
Are Stock Markets Setting Up For A New 'Black Monday'? | Zero Hedge
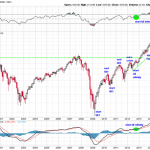
The major U.S. stock market indices finally corrected after a 9-month sideways trend. The ‘big’ news this week for stocks was undoubtedly that the four indices all closed below their 200-day moving average, which IS an important breakdown.
The key observation on the chart below, is the violation of the steep uptrend (highlighted with the rising green dotted line), which started with the announcement of the ‘QE infinity’ program in the autumn of 2012. We have marked the violation of the uptrend with a red circle. Make no mistake, this is a major event, with potentially a big impact!
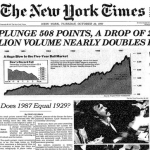
Even more so, when we consider recent market conditions and the fierce pullback, things are setting up a lot like the week before the horrific ‘Black Monday’ in 1987, when the Dow Jones Industrial took a punch of -22%! Check this, from Wikipedia:
On October 14, the DJIA dropped 95.46 points (3.8%) (a then record) to 2,412.70, and fell another 58 points (2.4%) the next day, down over 12% from the August 25 all-time high.
On Thursday, October 15, 1987, Iran hit the American-owned supertanker, the Sungari, with a Silkworm missile off Kuwait’s main Mina Al Ahmadi oil port. The next morning, Iran hit another ship, the U.S. flagged MV Sea Isle City, with another Silkworm missile.
On Friday, October 16, when all the markets in London were unexpectedly closed due to the Great Storm of 1987, the DJIA fell 108.35 points (4.6%) to close at 2,246.74 on record volume. Then-Treasury Secretary James Baker stated concerns about the falling prices.
A >20% correction would bring us to 1.580 points on the S&P 500, the previous break-out level! Coincidence? We don’t think so…
One thing is clear: the central bank driven QE program had a one-to-one correlation with the stock market. With a supposed ‘recovery of the economy’ it will be interesting to see how deep this correction will go, and how the monetary masters of the central banks will handle the correction. Is QE4 around the corner? Are we about to experience a Japan-style monetary stimulus leading the debt to GDP ratio to stratospheric levels? The chart suggests caution. Note that the MACD indicator fired a sell signal shortly after the ‘QE infinity’ program was ended. That was clearly a reliable early warning sign.
The precious metals market, however, is getting very interesting. Gold filled the gap after breaking down below $1,135 in July. This is a strong performance and important for chart analysis.
But didn’t most financial insitutions, investment banks, market experts, and other pundits, predict that gold would fall below $1,000 /oz? What about their forecasts?
Those forecasts were meaningless. Consider HSBC, who revised their gold price forecast upward this week, saying gold will be up 10% by the end of this year, worth around $1,225 an ounce.
Only three weeks ago, the same HSBC revised the gold price forecast downwards. On July 27th, the bank said that gold would average $1,160 per ounce in 2015 from $1,234 previously.
How meaningful are those forecasts?
From our perspective, the secular bull market in gold is resuming. We believe there is a fair chance that the trend change occurred two weeks ago, when China ‘de-pegged’ its currency from the U.S. dollar. Think about it, the second largest global economy said ‘goodbye’ to the dollar reserve currency. With their massive gold accumulation in recent years, China is more than ever relying on its ‘real’ monetary reserve, i.e. GOLD.
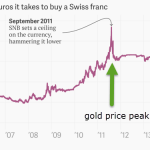
What happened with the Chinese currency is the opposite of what happened in September 2011. Uncoincidentally, the Swiss National Bank pegged its currency (the Swiss Franc) to the Euro exactly the same month the gold price peaked. The Swiss Franc, being a safe haven currency, was rising too rapidly … until the monetary planners of this world decided to break that trend. Gold stopped rising in the same month. We believe China did the opposite and instigated the rise in gold prices two weeks ago.
Based on the latest COT data from Friday 21st, it seems that gold’s recent rally is only a warm-up. The key indicator in the COT is the net short position of commercial traders, and its rate of change. The good news for gold bulls is that the net short position of those commercial traders is at all-time lows, even after the rally of this month. That means, in our view, the rally has considerable upside potential. With stocks correcting, and stock market optimism index at all-time lows, we believe the potential money inflows into the gold market are significant enough to launch gold prices much higher!
>>> Check Out Our Latest Gold Report!
Secular Investor offers a fresh look at investing. We analyze long lasting cycles, coupled with a collection of strategic investments and concrete tips for different types of assets. The methods and strategies are transformed into the Gold & Silver Report and the Commodity Report.
Follow us on Facebook @SecularInvestor [NEW] and Twitter @SecularInvest
Average:
4
Your rating: None Average: 4 (1 vote)
Original link:
Are Stock Markets Setting Up For A New 'Black Monday'? | Zero Hedge

