
18th February, 2014 – GOLD Elliott Wave Technical Analysis by Lara …
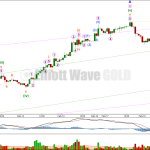
Price moved slightly higher to 2.28 above the previous target of 1,330, before turning downwards. Tuesday’s session has produced a clear red candlestick on the daily chart which is significant.
This analysis is published about 02:35 p.m. EST.
The wave count remains the same.
Summary: I expect there has been a trend change at 1,332.28. Overall price should continue lower for about seven to ten weeks from here.
Click on the charts below to enlarge.
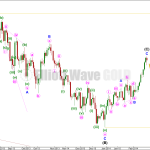
Gold is still within a large fourth wave correction at primary wave degree which is incomplete.
To determine what structure the current upwards movement is most likely to take it is necessary to determine what structure primary wave 4 is most likely to take.
Primary wave 2 was a rare running flat. Primary wave 4 is unlikely to be a flat correction because it is likely to show structural alternation with primary wave 2.
The first upwards wave within primary wave 4 labeled here intermediate wave (W) subdivides as a three wave zigzag. Primary wave 4 cannot be an unfolding zigzag because the first wave within a zigzag, wave A, must subdivide as a five.
Primary wave 4 is unlikely to be completing as a double zigzag because intermediate wave (X) is a deep 99% correction of intermediate wave (W). Double zigzags commonly have shallow X waves because their purpose it to deepen a correction when the first zigzag does not move price deep enough.
Primary wave 4 is most likely to be completing as a double combination: zigzag – X – second structure. The second structure labeled intermediate wave (Y) may be either a flat or a triangle. For both these structures minor wave A must be a three, and is most likely to be a zigzag.
Minor wave A is a complete zigzag.
Minor wave B downwards must retrace a minimum of 90% the length of minor wave A at 1,195.98 if intermediate wave (Y) is a flat correction. If intermediate wave (Y) is a triangle then there is no minimum requirement for minor wave B within it.
Minor wave B must subdivide as a corrective structure, and there are more than thirteen possible corrective structures it may take. Within it minute wave a may be either a three or a five, and when it is complete and its structure is clear then we shall have a clearer idea of what structure minor wave B may be. Over the next few days I will publish alternate hourly wave counts to consider all the different possible structures for minute wave a.
Primary wave 4 may not move into primary wave 1 price territory. This wave count is invalidated with movement above 1,532.90.
Draw a channel about the zigzag of minor wave A: draw the first trend line from the start of minute wave a to the end of minute wave b, then place a parallel copy upon the end of minute wave a. A clear channel breach of this channel with a full daily candlestick below the lower edge and not touching the lower trend line would provide trend channel confirmation of a trend change at minor degree.
I have played with changing the scale from arithmetic to semilogarithmic. It looks like a semilogarithmic scale for both the daily and hourly charts may better show where price is finding support and resistance at the trend lines drawn.
Yesterday’s main hourly wave count did not expect movement above 1,329.95. However, the final small upwards thrust fits best as a continuation of the final fifth wave.
The clear red candlestick on the daily chart created by downwards movement from 1,332.28 is significant. This does not look like a fourth wave correction within minute wave c. I would not expect it to show as a red candlestick while its counterpart minuette wave (ii) did not show on the daily chart as clearly. It is for this reason that I am not publishing yesterday’s alternate hourly wave count.
The following downwards movement has taken price back into the pink channel containing all of minor wave A, and found support at the upper edge of the channel containing minute wave c.
At this stage within minor wave B the first movement down should subdivide as a five wave structure at subminuette wave degree. When that is complete an upwards correction should follow. This first five down may be an A wave of a zigzag, or it may be a first wave of a new impulse for minute wave a.
When the first 5-3-5 down is complete then I will start to use alternate wave counts to manage the various possible structures that minute wave a may unfold as.
Minor wave B is most likely to be a zigzag, and so minute wave a within it is most likely to unfold as a five wave motive structure.
Within the first downwards movement subminuette wave ii may not move beyond the start of subminuette wave i. This wave count is invalidated with movement above 1,332.28.
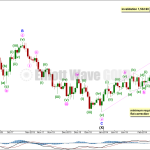
Alternate Daily Wave Count – Triangle.
It is also possible that primary wave 4 may continue as a regular contracting (or barrier) triangle.
However, at this stage this triangle scenario looks less likely. It is my experience that the subwaves of contracting triangles are often about 80% to 85% the length of the prior subwave. In this case intermediate wave (C) is only 60% of intermediate wave (B). It looks too short, giving this possible triangle a slightly unusual look overall.
I will keep this possibility charted for you, but at this stage I judge it to have a decreased probability.
Triangles take up time and move price sideways. If primary wave 4 unfolds as a triangle then I would expect it to last months rather than weeks.
Link –
18th February, 2014 – GOLD Elliott Wave Technical Analysis by Lara …
See which stocks are being affected by Social Media

