
21st November, 2013 – GOLD Elliott Wave Technical Analysis …
Yesterday’s analysis expected a third wave downwards to end about 1,234 to 1,236. The third wave has ended at 1,236.89.
The wave count remains the same.
Click on the charts below to enlarge.
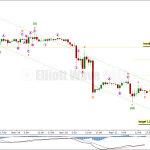
Gold is still within a large fourth wave correction at primary wave degree which is incomplete. It is now more likely to continue as a double combination because within it intermediate wave (X) should be deep.
The purpose of double combinations is to take up time and move price sideways, so I would now expect intermediate wave (Y) to end about the same level as intermediate wave (W) at 1,433.83. Double combinations in fourth wave positions are quite common.
If downwards movement reaches 1,205.74 or below then it would be 90% of the prior upwards movement labeled intermediate wave (W). At that stage I would relabel primary wave 4 as a flat correction, A-B-C rather than a combination W-X-Y.
Within the combination intermediate wave (X) is unfolding as a zigzag. Minor wave C downwards must complete as a five wave structure. At 1,206 minor wave C would reach equality in length with minor wave A. Within minor wave C at 1,198 minute wave v would reach 1.618 the length of minute wave i. This gives an $8 target zone for downwards movement to end. I will try to narrow this zone as the structure gets closer to the end.
There is no lower invalidation point for intermediate wave (X); X waves may make new price extremes beyond the start of W waves, and they may behave like B waves within flat corrections. For combinations X waves often end close to the start of W waves.
I have drawn a parallel channel about the zigzag of intermediate wave (X) using Elliott’s technique for a correction. Draw the first trend line from the start of minor wave A to the end of minor wave B. Place a parallel copy upon the end of minor wave A. I will expect minor wave C to find support at the lower end of this channel, and it may end there.
Primary wave 4 may not move into primary wave 1 price territory. This wave count is invalidated with movement above 1,532.90.
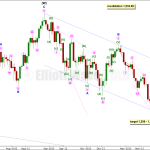
There are several ways to label this downwards wave of minute wave v so far. This labeling has the best fit.
On the daily chart it looks like minute wave v may have entered the fourth wave within it, so this fits with the look on the daily chart.
If minuette wave (iii) is over at 1,236.89 then it is 2.45 short of 2.618 the length of minuette wave (i).
Ratios within minuette wave (iii) are: there is no Fibonacci ratio between subminuette waves iii and i, and subminuette wave v is just 0.34 short of 0.618 the length of subminuette wave i.
The strongest downwards movement is the middle of the third wave. This wave count fits perfectly, so far, with MACD.
Draw a parallel channel about minute wave v using Elliott’s first technique. Draw the first trend line from the lows labeled minuette waves (i) to (iii), then place a parallel copy upon the high labeled minuette wave (ii). I will expect minuette wave (iv) to find resistance at the upper edge of this channel.
Minuette wave iv should show alternation with minuette wave (ii). Minuette wave (ii) was a relatively shallow 45% double combination correction. Minuette wave (iv) may show alternation in depth and / or structure. So far it looks like it may be unfolding as a zigzag which would provide alternation in structure. If it finds resistance at the upper edge of the channel it may end about the 0.236 Fibonacci ratio of minuette wave (iii) at 1,246.71, and show some alternation in depth also.
Minuette wave (iv) may not move into minuette wave (i) price territory. This wave count is invalidated with movement above 1,270.14.
Read more:
21st November, 2013 – GOLD Elliott Wave Technical Analysis …
See which stocks are being affected by Social Media

