
4 Cheap Mining Stocks Trading At Fractions Of Classic S&P 500 …
(Editors’ Note: This article covers a micro-cap stock. Please be aware of the risks associated with these stocks.)
There’s no doubt about it – gold is an unloved and unwanted investment these days to all but the hardiest of precious metals investors, the retail Chinese investor, and according to Brent Johnson of Santiago Capital, those who believe in math. If you want to be a contrarian, then gold is the investment for you. But if you want to be really contrarian, then the investment isn’t gold, but the gold miners – maybe the only investment class that is more hated than gold.
Since we are contrarian investors to our core, we believe the best place to look for future investment performance is the assets that nobody wants. We want to buy what others have thrown in the towel on and will sell at any price just to get it out of their portfolio – and there’s no better place to look for that type of psychology than in the gold and silver mining stocks.
What is Cheap?
Whenever an investor hears that a certain asset or stock is cheap they always have to ask themselves, “Compared to what?” It is worth noting that “cheap” doesn’t exist unless it is compared to something else – what exactly is that asset cheap compared to? A price-to-earnings ratio of 10 may be very expensive if the rest of the market or industry is selling at a P/E of 5, it is all relative.
Additionally, one of the biggest mistakes that new or young investors make is thinking that a large price drop of a stock means that it has gotten cheap. It may or may not be cheap, but the price action itself tells you nothing about how “cheap” a stock is – you have to look at other metrics to attach that “cheap” label to the company.
Price-to-Sales & Enterprise Value to Sales Ratios
The first ratio that we will use in this article to value how cheap these stocks are is the price-to-sales ratio (P/S ratio) which is simply the total market capitalization of the company divided by the company’s sales. We will be using the inverse of this ratio (Sales divided by Market Capitalization which we will call S/MC) because it’s a bit more intuitive, and it is essentially how many dollars of sales do you get for every investment dollar. All else equal, the higher the ratio the better because it means for every investment dollar you get more dollars worth of revenues.
The second ratio we will be using is the EV-to-sales ratio (EV/S ratio), which is the same thing as the price-to-sales ratio except that instead of using the company’s market capitalization we will use the enterprise value of the company. For those unfamiliar with enterprise value you can read up about it here, but essentially it is market capitalization plus debt and minus cash and cash equivalents. This will give an investor the value that the market is attaching to the company’s enterprise and in many ways it is far superior to simple market capitalization when assessing the valuation of a company. Again, we will be using the inverse of this ratio because it is more intuitive (Sales divided by Enterprise Value (S/EV)).
This article isn’t a primer on valuation metrics, but investors should note that there is no perfect or stand-alone metric that alone can be judged whether to buy or sell a stock and each has its pros and cons. Both S/EV and S/MC offer a way to measure how cheap companies are, but profit margins are also key in evaluating these metrics because they give an idea of how “efficient” a company is at turning sales into profits – which is the ultimate measure of the value of an investment to an investor. Thus a company with high S/EV may not be cheaper than a company with a low S/EV if the latter company has higher profit margins. There is a lot more to be said about this metric but it is beyond the scope of this article.
Finally, in terms of the mining industry (and energy to some degree), this metric may actually be more helpful in providing a measure of valuation for companies. That’s because in most industries, sales is relatively stable and predictable for established companies (which tend to have higher S/MC’s and S/EV’s) – you don’t expect the Wal-Marts (WMT) or the Apples (AAPL) of the world to increase sales 25% or 30% annually. Additionally, even if sales increase for these types of companies, the profit margins tend to be relatively stable – a 25% increase in revenues usually translates into a 25-30% increase in net profits all else equal.
The miners are very different because their revenues are dependent on the prevailing price of the commodity they produce – thus it is very possible that a large company’s revenues could increase or decrease by 30% if the underlying commodity moves by that amount. Additionally, the profit margins are even more volatile because if the price of the commodity increases it is not a one-to-one relationship to net profits – all else equal most of the increase goes directly into profits.
For example, if a company like Wal-Mart increases its revenues by 10%, then its profit margin will most likely rise by around that 10%. Why? Because other than a straight price increase by 10% (which is very rare) the additional revenue increase is a result of an increase in product sales, which also means that COGS increases, transportation, wages (employees will probably be working more hours if more goods are sold), and a few other costs will rise in proportion to a rise in sales.
With a miner it is a bit different. If the price of gold increases by 10%, then the miner’s revenues will increase by 10% less taxes – without the miner doing anything different. This is because the increase in revenues comes without any corresponding increase in production costs, the same number of employees is used, the same amount of energy is used, the company incurs the same transportation costs, and obviously the same fixed costs. Other than the additional taxes on the new revenues, the rest of the revenue increase will probably go directly to profits. Thus a miner that has a 10% profit margin that sees a 10% rise in gold with a 30% tax rate, could see its profits almost double with that 10% increase (10% profit margin plus 7% increase in profits due to 10% gold increase).
Thus it could be argued that miners with high S/EV ratios are even more undervalued than traditional companies with the same S/EV values, simply because their profits could double with minor increases in the price of the underlying commodity.
Our Baselines
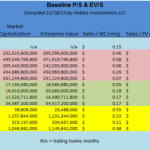
As we mentioned earlier, you cannot determine how cheap an asset is without some sort of comparison or baseline. For our baseline we will be using the S&P 500 P/S, the P/EV of a few major non-mining companies, and some of the mining industry leaders. This should give us a good baseline to see how cheap these companies really are.
As investors can see in the table above, the average S&P 500 (SPY) company has a Sales-to-Market-Capitalization of .62 over the trailing twelve months (TTM) and .15 over the most recent quarter (mrq). We didn’t have data for the enterprise value of the S&P 500, but we assume that since companies are increasing their debt loads it will be a bit below the market capitalization values.
Anyhow, this data signifies that at the current S&P 500 valuation, an investor would get 62 cents of annual sales for every $1.00 invested. Though beyond the scope of this article, it is interesting to note that this is the highest annual ratio for the S&P 500 since December 2000 – investors are getting the least amount of S&P 500 sales per dollar invested since the NASDAQ bubble.
Let us now take a look at a snapshot of some of the top S&P 500 companies to get a feel of some of these ratios on an individual company basis. As investors can see, Wal-Mart clearly has one of the best Sales/MC ratios at $1.88, but Wal-Mart’s Enterprise Value ratio is a bit less at $1.55 since it has accumulated a bit of debt. Apple and Microsoft (MSFT) with mature technology related businesses have much lower ratios, but much of that is made up for with their much higher profit margins. Finally, Exxon Mobil (XOM) which is one of the quintessential energy related value companies and perhaps a better comparison for the gold miners since it is a commodity related business, has a relatively good S/MC ratio of .91 and S/EV of .88.
For the gold miners we’ve added the majors [and Freeport-McMoRan Copper & Gold (FCX)] to get an idea of what the valuations for the largest gold miners. Finally, we’ve selected a group of the cheapest precious metals miners based on S/MC and S/EV so a quick comparison can be made. Investors should remember that a lower value doesn’t necessarily mean the company is a worse value, if more production is expected to come on stream over the next year then it is obviously justified to have a higher valuation based on these ratios since sales is expected to increase.
Let’s now look at the cheaper companies based on these metrics.
Newmont Mining (NEM) – with a S/MC ratio of .75 it is actually cheaper than the average S&P 500 stock and has the best ratios of the majors we analyzed (though Goldcorp (GG) is expected to increase production significantly in 2014). For a cheap major, Newmont is a company that investors may want to consider but they should also note that it has quite a large amount of debt (around $6.5 billion or 50% of its market capitalization).
IAMGOLD (IAG) – with a S/MC ratio of 1.29 and a S/EV of 1.32 ranks very highly compared to both the S&P 500 and the gold majors. Investors are getting $1.29 of sales for every $1.00 invested, which makes it cheap even compared to Exxon. The company recently suspended its dividend (a good move in our opinion) so its shares took a hit, but in terms of cheap mid-tier companies on this metric very few compare.
Endeavour Silver (EXK) – with a S/MC ratio of .85 and a S/EV of .82, Endeavour Silver ranks well compared to the S&P 500, the majors, and to fellow silver companies, and is one of the cheapest silver companies based on this metric. The company’s operations are solely based in Mexico, and the recent tax law passed by the Mexican government has really hurt investor confidence in the profitability of Mexican based precious metals companies at current precious metal prices. But at the current price compared to its fellow silver companies it may offer investors quite a bargain.
Richmont Mines (RIC) – we saved the cheapest and perhaps best for last. Richmont Mines is a small capitalization Canadian gold miner with underground mining operations in Quebec. With an S/MC of 2.28 and a S/EV of 3.76, the company’s ratios are some of the best in the market and are really off the charts in terms of investor bang for the buck. Obviously, gold prices have fallen so ttm may not be the most appropriate ratio to use, but even the companies third quarter S/EV ratio of .90 means that investors are getting almost $1 for every dollar invested ON A QUARTERLY BASIS – that’s with gold prices averaging a little over $1300 which is not particularly far off.
That’s a really stunning ratio and we believe that it is primarily due to Richmont being a small capitalization company with a lack of investor interest in the industry. Additionally, the company costs are not particularly high for the industry (around $1300) so it’s not like the company is producing gold at horribly expensive costs.
The biggest worry for investors with Richmont (other than the gold price) should be concerns about if management engages in any type of gold hedging or selling forward future gold at a fixed price. If so, investors should flee this company since it wouldn’t be worth owning if gold has been sold forward at prices anywhere close to the current price level. But if the company remains unhedged, then its valuation is extremely cheap and offers investors a tremendous value at the current price level with any moderate increase in the price of gold – it is selling 3 or 4 times cheaper than even the other gold miners which are selling a cheap valuations themselves.
Conclusion for Investors
All companies mentioned should be investigated further, but with the S&P 500 hitting almost record S/MC valuations and almost all industries close to all-time highs in this metric, the gold mining industry provides much more bang for an investor’s buck. If we see a moderate increase in the price of gold (and we expect at least that since gold costs are below all-in production costs) then these valuations are extremely cheap. And if we see some sort of catalyst that causes gold to surge, then at current valuations we can expect profits to surge at the miners since sales to market capitalizations and enterprise valuations are so high – most of that surge should translate directly into net profits. Investors seeking contrarian positions, cheap valuations, or simply not wanting to buy the S&P 500 close to all-time S/MC ratio highs should look to the miners.
Source:
4 Cheap Mining Stocks Trading At Fractions Of Classic S&P 500 Value Stocks
Disclosure: I am long RIC, EXK, GG. I wrote this article myself, and it expresses my own opinions. I am not receiving compensation for it (other than from Seeking Alpha). I have no business relationship with any company whose stock is mentioned in this article. (More…)
Continue reading here:
4 Cheap Mining Stocks Trading At Fractions Of Classic S&P 500 …

