
Are U.S. Stocks Overpriced? Using Earnings Adjusted Historic …
Summary
A prolonged bull market has provoked questions about an inevitable downturn, with some pundits arguing there is more upside left, and others arguing that a major correction is imminent.
Analyses of historic trading ranges as a function of earnings per share for specific stocks provide plausible criteria by which we might recognize substantial downside potential for stocks.
Three stocks are analyzed from this perspective, with one appearing overpriced, and another appearing reasonably valued. Another appeared highly priced but within expected ranges.
Is the Market Too High?
The present bull market has been substantial and prolonged, and it is reasonable to ask if stock prices are too high. The answer to this question depends upon two other questions, namely, “How would we know it if they were too high?” and “If prices are too high, just how ‘too high’ are they?”
Annual trading ranges, defined by the lowest share price and highest share price of a stock in a specific year are often substantially correlated with earnings per share for that year. The method of analysis is to plot the maximum and minimum share prices as a function of earnings per share; fit the best algebraic function for those data, and apply the derived functions to current and future earnings estimates in order to compute predictions of current and future trading ranges. Three case studies follow:
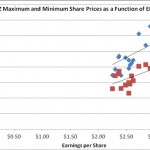
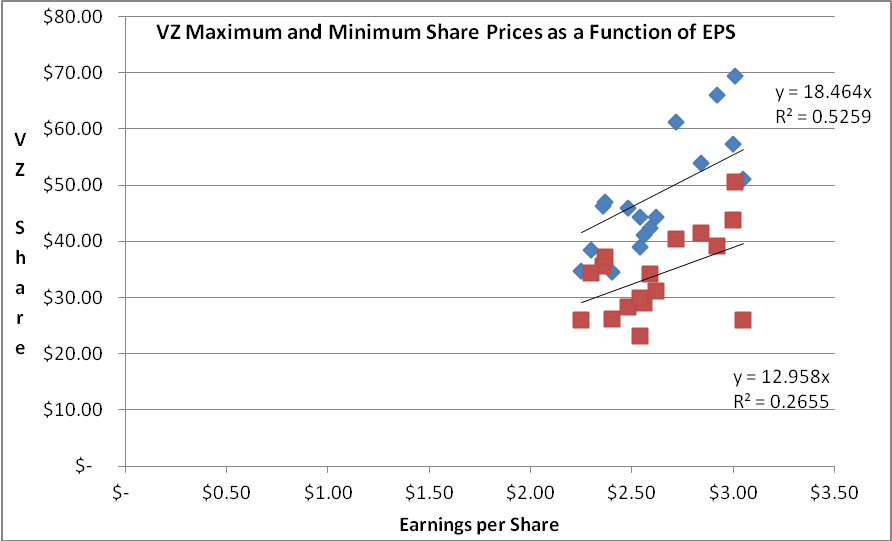
The case of Verizon (NYSE:VZ): The graph below displays the high and low stock prices for VZ over the past 17 years. (Source: Value Line Investment Survey) The equation of a plausible estimate of the maximum share price is 18.464 X eps. The equation for an estimate of the minimum price is 12.2598 X eps. These equations are computed by Excel. VZ is followed by at least 32 analysts who currently project an average 2014 eps of $3.54 (Source: Yahoo Finance). This eps estimate corresponds to an estimated low trading price of $45.87 and an estimated high trading price of $65.36. The closing price of VZ on 7/25/2014 was $51.28. This closing price is below the highest estimated price of $65.36, and it is also below the middle range price of $55.62. It would be difficult to argue that the price of VZ is too high. In fact, if the lower third of the trading range ( < $52.37 ) were used to define a “BUY” range, VZ is even in a viable range for purchase.
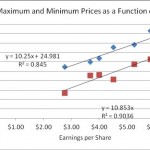
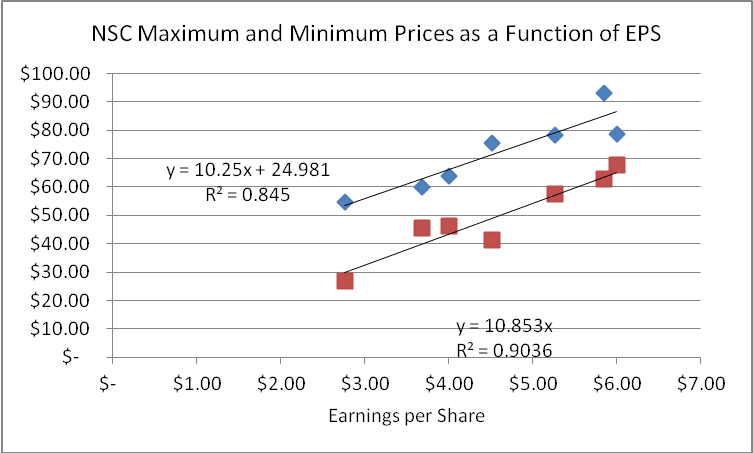
The case of Norfolk Southern Corporation (NYSE:NSC): The graph below displays the trading range maximums and minimums for NSC over the past 7 years. (Source: Value Line Investment Survey) The best fit of the algebraic function relating the maximum to earnings is Maximum = $10.25 X eps + $24.98. Note that this expression is not a simple PE Ratio average. The best fit relating the minimum to earnings is Minimum = $10.853 X eps. The current 2014 average earnings estimate of 25 analysts is $6.46 (Source: Yahoo Finance) This estimate yields a predicted trading range of $70.11 to $91.20. The current price of NSC is $107.50 (July 25, 2014), which is $16.30 or 15.2% greater than the estimated maximum. It is also $23.33, or 21.7% greater than the top one-third of the estimated trading range, and $26.85 or 25% greater than the mid-point of the estimated trading range. Depending upon how one defines “overpriced,” NSC would be seem to be in the ball park of 15% – 20% overpriced.
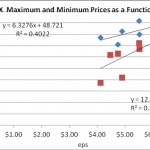
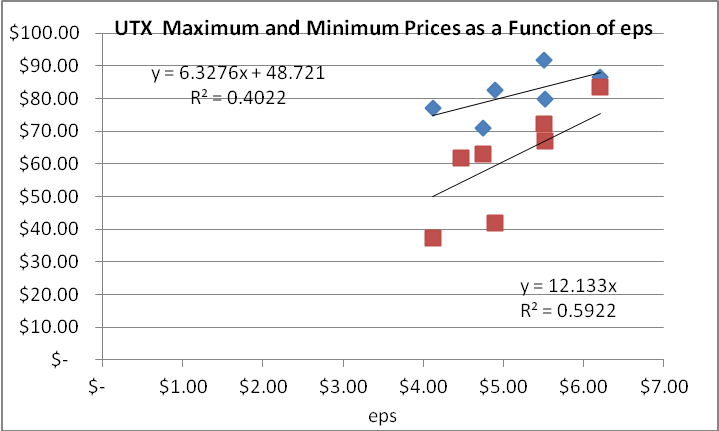
The case of (NYSE:UTX) Corporation: The graph below displays the maximum and minimum share values of UTX as a function of earnings per share, over the past seven years. The estimated 2014 earning per share is $6.86, based upon the average estimate of 19 analysts. (Source: Yahoo Finance) The indicated trading range for 2014 is $83.23 to $116.56. As of the July 25th closing price was $108.88. This price is $7.68 (7.1%) below the projected maximum, and only $8.98 (8.3%) above the projected mid-range value. While clearly not “over-priced,” the current price is relatively high, even if not outside of the projected trading range.
The implicit assumption in these three analyses is that historic trading ranges, adjusted for earnings, will be replicated in the present and future. This may or may not turn out to be a valid assumption. Although VZ appears to be in a reasonable range for buying, several recent acquisitions by the company may have resulted in a substantial change in corporate character, rendering historic trading ranges inapplicable to future trading. In addition, a novel trading environment, such as the current low interest rates, may also alter the significance of historic trading ranges. While NSC might appear to be overpriced by historical standards, the new interest rate environment might render the current prices more “normal” and sustainable. Nevertheless, having acknowledged these caveats, analyses of trading ranges is a plausible way to start. Some investors may want to try to use this method using dividend paid or some measure of cash flow, rather than earnings.
Is the market too high? These three analyses suggest there is no simple answer. At least one stock appears to be reasonably priced. At least one is overpriced. And the other is relatively high, but not outside of expected ranges.
Source:
Are U.S. Stocks Overpriced? Using Earnings Adjusted Historic Trading Ranges As A Valuation Method
Disclosure: The author has no positions in any stocks mentioned, but may initiate a long position in VZ over the next 72 hours. The author wrote this article themselves, and it expresses their own opinions. The author is not receiving compensation for it. The author has no business relationship with any company whose stock is mentioned in this article. (More…)
View original –
Are U.S. Stocks Overpriced? Using Earnings Adjusted Historic …
See which stocks are being affected by Social Media

