
Beware of Sentiment Pies – Just Drive Media
Posted by
One of the most valuable insights gained from social listening is sentiment surrounding your brand. What do people like about your products and services? What ticks them off? What do they not care about? Where is sentiment about your brand headed? What do these same people think about your competitors?
Accurate analysis can provide a wealth of information for product teams, marketing departments and even potential investors. It should go without saying that being able to answer these questions is vital to the health of your company. So brands and analysis firms should make sure they ask the right questions so that they receive useful answers from social listening.
The following might seem painfully obvious to some, but rookie analysts and established social agencies alike sometimes make a fantastic leap when looking at brand sentiment over time. And the bigger the social conversation surrounding your brand, the more misleading this leap can be.
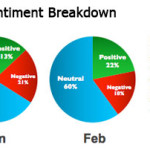
Let’s say you are doing monthly analysis of the biggest fictional retail brand in the US, GloboMart. Comparing December to January, you notice that as a percentage of the total conversation, negative mentions are down 3%. Cosmetically, this looks like a step in the right direction for your client. In reality, it doesn’t mean a thing. In fact, it’s pure poison.
Why? Sentiment pies don’t take volume into account. Negative mentions are down as a percentage of what?
We’ll stay with our hypothetical, although we see this in the real world all the time. In January, a tech blogger writes a provocative headline that is retweeted and liked thousands of times. “Amazon’s Drone Delivery Will Be a Knife In GloboMart’s Heart.” Your client has decided that articles comparing hypothetical services with real world business practices should be thrown in the neutral bin with everything from affiliate spam to jokes about shopping at GloboMart. So now, as a proportion of total mentions, people complaining about long lines or your online shopping experience has plummeted! Except it hasn’t. And if you happen to glance at last month’s report or rely on an off-the-shelf listening tools visualizations, you’re in trouble.
Converting out pies into a bar graph is a good way to steer clear of this mistake. Even the bar graph barely shows that negative sentiment spiked 50% in January.
Stay tuned for Part 2: Better Living Through Data Visualization as we go beyond pies and bar graphs to express brand sentiment.
Source:
Beware of Sentiment Pies – Just Drive Media

