

Biotech Stocks: What's Hot, What's Not – As Seen By Market-Makers …
Summary
Hot = near-term stock price gain potential, not just product developments, lab breakthroughs, corporate acquisitions, financing deals, trial progresses etc.
Only opinions; not even “just the facts, m’aam”. But opinions expressed by folks who need to know, willing to put their money at risk, based on what they know.
Maybe even better, ones who are willing to pay up for price-change risk protection on top of having their money at risk, temporarily.
They help their big-money-fund clients buy and sell big blocks of these tricky biotech stocks, day in and day out, talk with them daily, know the “order flow”.
Their hedging tells just how far they sense the clients are likely to push prices, both up and down, how soon, or not for a while yet.
Behaviors of those intimately involved tell the story
Our opinions of biotechnology development breakthroughs are mostly humanitarian appreciation, applause; hardly scientific insights.
But as behavioral analysts, we have useful, frequently profitable, insights into the prospects for coming price changes in biotech stocks. We get them from the ways that market-makers [MMs] respond to their clients, investment portfolio managers [PMs] for big-money funds that buy and sell actively moving stocks in big blocks because that is what it takes to make a difference in fund portfolios of their size.
The MMs get involved because markets often get pushed beyond their normal capacities to provide a match between buyers and sellers at prices desired by the PMs in the time frames they are willing to accept. The MMs will step in to make up the imbalance between buyers and sellers created by the PMs’ big-volume orders, putting their own capital at risk in the process.
They will, if they can engineer hedging transactions to transfer the risks involved to others via price-change insurance deals in derivative securities, in related markets, at a cost that will be acceptable when passed on to the PM issuing the trade order. That cost, and the way it is structured, tells just how far all involved believe the stock’s price may move in the near future.
Trust, but verify
We take their implied price range forecasts and compare them to what has occurred in the market following prior similar forecasts, developing a sense of probable credibility and reliability – odds and scale of performance. When done for many biotech (or any other) stocks or ETFs, we then have a means of direct comparison of their investment attractiveness.
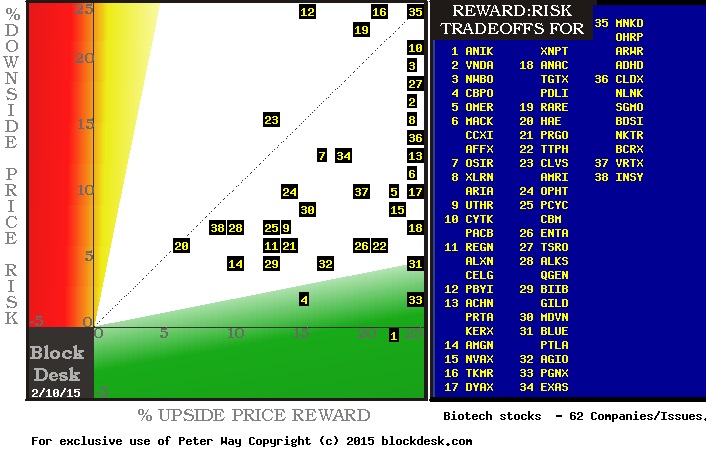
Here is a picture of how the upside price change prospects (rewards) of several biotech stocks match up with their actual worst-case price drawdowns experienced following earlier forecasts similar to those of today.
Figure 1
(Used with permission)
The intersection of upside price change prospects from the green horizontal scale and the past price drawdown experiences from the red vertical scale can be identified by [ ] number corresponding to the stock symbols in the blue field to the right. Subjects above the diagonal dotted line have larger bad experiences than current potentials. Those in the green area enjoy reward expectations at least 5 times their prior risk exposures.
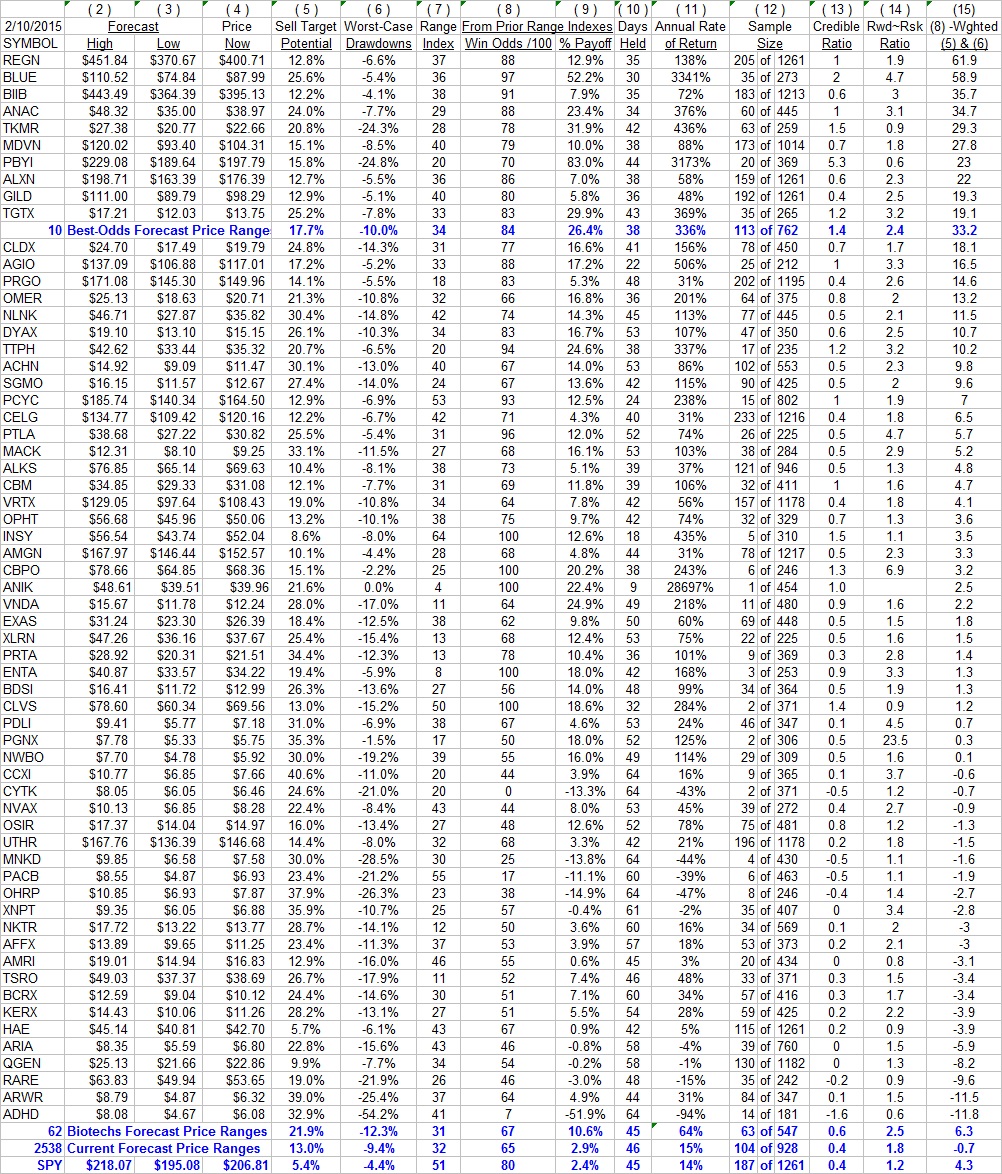
Other considerations, like ODDS of a profitable investment experience from here, frequency and extent of prior experiences, and PAYOFFS at an attractive scale in typical holding periods involved, are detailed in the table of Figure 2. A more complete discussion of how this data comes about and its importance can be found at our website, blockdesk.com.
Figure 2
These 60+ stocks have been ranked in terms of the trade-off between their expected returns in column (5) and experienced risks from (6) in the proportion of their winning odds in (8) from their frequency of prior days’ forecast experiences in the past 5 years (12) as shown in the figure of merit in column (15). At present, Regeneron Pharmaceuticals (NASDAQ:REGN) stands at the head of this list. It is located at [11] in Figure 1.
Several other investment dimensions are frequently of interest, and the details of Figure 2 provide many of them for comparison purposes.
Blue row averages also provide perspective in comparing these stocks as a group or subgroups to the 2,500+ stocks and ETFs of our population at large, which is evaluated daily. Data for the SPDR S&P 500 ETF (NYSEARCA:SPY) is included as a proxy for the market of established equities.
Conclusion
Biotech stocks at present offer high-reward potentials of nearly +22% in the 3-month time horizon used for comparisons in this analysis, compared with +13% prospects for stocks at large and +5.4% for the S&P 500. Biotechs’ typical price drawdowns encountered en route to achieving such promises have been -12% or more, greater than the -9% of the stock population or the -4.4% of the S&P 500.
Actual price gains achieved by the biotech group following forecasts like today’s have been +10.6%, compared to the population’s near +3%, and the S&P 500’s +2.4%. Average holding periods of 45-46 market days, or a few days more than two 21-day months convert those gains into annual rates of +64% for the biotechs, compared to +14-15% for others.
Source:
Biotech Stocks: What’s Hot, What’s Not – As Seen By Market-Makers, Their Clients
Disclosure: The author has no positions in any stocks mentioned, and no plans to initiate any positions within the next 72 hours. (More…)The author wrote this article themselves, and it expresses their own opinions. The author is not receiving compensation for it (other than from Seeking Alpha). The author has no business relationship with any company whose stock is mentioned in this article.
View the original here:
Biotech Stocks: What's Hot, What's Not – As Seen By Market-Makers …

