
Can Facebook See Its Stock Move Higher? – Wall St. Cheat Sheet
With shares of Facebook (NASDAQ:FB) trading around $61, is FB an OUTPERFORM, WAIT AND SEE or STAY AWAY? Let’s analyze the stock with the relevant sections of our CHEAT SHEET investing framework:
T = Trends for a Stock’s Movement
Facebook is engaged in building social products in order to create utility for users, developers, and advertisers. People use Facebook to stay connected with their friends and family, to discover what is going on in the world around them, and to share and express what matters to them with the people they care about. Developers can use the Facebook platform to build applications and websites that integrate with Facebook to reach its global network of users, building personalized and social products. Advertisers can engage with more than 900 million monthly active users on Facebook — or subsets of its users — based on information they have chosen to share.
Facebook is planning to scale back the organic reach of its Pages, meaning that business will have to pay up if they want to reach their fans to the extent they’ve become accustomed to, according to a Time report on Saturday. According to a study profiled in Time, business and celebrity pages reached an estimated 12 percent of their followers through news feed updates in October; that number dropped to just 6 percent by February, and supposedly Facebook execs are planning to scale back the reach of Pages further to a mere 1-2 percent of followers. The last publicly disclosed figure regarding the percentage of fans that see posts from a typical Facebook page was released in the summer of 2012; at that time, the company said that approximately 16 percent of fans were reached by news feed posts from pages they’d liked. In December, Facebook finally admitted that posts from pages are reaching less users than previously, which the company said it attributes to increased competition as more and more businesses and celebrities join the social media service. The typical Facebook user sees more than 1,500 posts per day from a combination of friends and Pages; of those 1,500, Facebook selects 300 posts to display on the user’s news feed, Time reports.
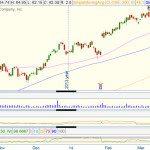
T = Technicals on the Stock Chart are Mixed
Facebook stock has been exploding to the upside in recent years. However, the stock is currently pulling back and may need time to stabilize. Analyzing the price trend and its strength can be done using key simple moving averages. What are the key moving averages? The 50-day (pink), 100-day (blue), and 200-day (yellow) simple moving averages. As seen in the daily price chart below, Facebook is trading between its rising key averages which signal neutral price action in the near-term.
Save Time Make Money! A new stock idea each week for less than the cost of a trade. CLICK HERE for your Weekly Stock Cheat Sheets NOW!
Source: Thinkorswim
Taking a look at the implied volatility (red) and implied volatility skew levels of Facebook options may help determine if investors are bullish, neutral, or bearish.
Implied Volatility (IV)
30-Day IV Percentile
90-Day IV Percentile
Facebook options
47.52%
96%
94%
What does this mean? This means that investors or traders are buying a very significant amount of call and put options contracts, as compared to the last 30 and 90 trading days.
Put IV Skew
Call IV Skew
April Options
Average
Average
May Options
Average
Average
As of today, there is an average demand from call and put buyers or sellers, all neutral over the next two months. To summarize, investors are buying a very significant amount of call and put option contracts and are leaning neutral over the next two months.
On the next page, let’s take a look at the earnings and revenue growth rates and the conclusion.
E = Earnings Are Increasing Quarter-Over-Quarter
Rising stock prices are often strongly correlated with rising earnings and revenue growth rates. Also, the last four quarterly earnings announcement reactions help gauge investor sentiment on Facebook’s stock. What do the last four quarterly earnings and revenue growth (Y-O-Y) figures for Facebook look like and more importantly, how did the markets like these numbers?
2013 Q4
2013 Q3
2013 Q2
2013 Q1
Earnings Growth (Y-O-Y)
1,322.38%
108.33%
58.33%
0.00%
Revenue Growth (Y-O-Y)
5.65%
59.75%
53.13%
37.81%
Earnings Reaction
14.10%
2.44%
29.61%
5.61%
Facebook has seen increasing earnings and revenue figures over the last four quarters. From these numbers, the markets have had conflicting feelings about Facebook’s recent earnings announcements.
Save Time Make Money! A new stock idea each week for less than the cost of a trade. CLICK HERE for your Weekly Stock Cheat Sheets NOW!
P = Excellent Relative Performance Versus Peers and Sector
How has Facebook stock done relative to its peers, Microsoft (NASDAQ:MSFT), Google (NASDAQ:GOOG), LinkedIn (NASDAQ:LNKD), and sector?
Microsoft
Sector
Year-to-Date Return
14.24%
6.63%
3.13%
-13.30%
3.67%
Facebook has been a relative performance leader, year-to-date.
Conclusion
Facebook looks to provide a valuable social networking experience to its users, developers, and advertisers. The company is planning to scale back the organic reach of its Pages, meaning that business will have to pay up if they want to reach their fans to the extent they’ve become accustomed to. The stock has been exploding to the upside, but is currently pulling back. Over the last four quarters, earnings and revenues have been increasing. However, investors have had conflicting feelings about recent earnings announcements. Relative to its peers and sector, Facebook has been a relative year-to-date performance leader. Look for Facebook to continue to OUTPERFORM.
Using a solid investing framework such as this can help improve your stock-picking skills. Don’t waste another minute — click here and get our CHEAT SHEET stock picks now.
More From Wall St. Cheat Sheet:
Facebook Goes Futuristic, Acquires Oculus
WhatsApp and LINE Take Aim at Mobile Carriers
Mark Zuckerberg Lambasts the NSA, Calls Obama to Complain
More:
Can Facebook See Its Stock Move Higher? – Wall St. Cheat Sheet

