
Comex Gold Futures (GC) Technical Analysis – August 13, 2014 …
Get Forex buy/sell signals directly to your email and by SMS.
December Comex Gold futures surged higher on Tuesday before backing off to finish nearly unchanged. The market continued to consolidate inside Friday’s wide range while straddling a key 50% price level. Both moves indicate trader indecision. The uncertainty over geopolitical events continue to underpin the market, but gains have been limited by stubborn shorts who believe these events have been fully-priced into the market. Bullish traders, however, are playing for an escalation of the events in Ukraine, Gaza or Iraq.
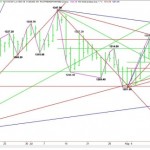
Daily December Comex Gold
The main trend is up on the daily chart. The trend turned up last week when buyers took out $1314.60. Because of the lack of follow-through to the upside after spiking up to $1324.30, one has to conclude that the rally was triggered by short-covering rather than new buying. This may mean gold has to correct into a value zone in order at attract fresh buying.
The main range is $1347.50 to $1281.00. Its retracement zone at $1314.30 to $1322.10 has stopped rallies over the past three days. This area has to be cleared in order to trigger the next rally.
Downtrending resistance comes in at $1323.50 today. This angle forms a resistance cluster with the upper or Fibonacci level at $1322.10. This area has to be taken out with conviction before buyers can work on last week’s high at $1324.30.
The close below the lower or 50% level at $1314.30 gives gold an early downside bias today. The key angle to watch is an uptrending angle from the $1281.00 bottom at $1313.00. A failure to hold this angle will put gold in a weak position.
The short-term range is $1281.00 to $1324.30. The retracement zone formed by this range is $1302.60 to $1297.50. A major 50% level comes in at $1294.60. Additionally, an uptrending angle comes in at $1297.00. This angle forms a tight support cluster with the Fibonacci level at $1297.50 and a loose support cluster with the major 50% level at $1294.60. This area is the next likely downside target and best value area.
Since the main trend is up on the daily chart, value-seeking buyers are likely to step in following a test of $1302.60 to $1297.50. The best downside target to watch for buyers is $1297.50 to $1294.60.
The tone of the market today is likely to be determined by trader reaction to the angle at $1313.00. This price could act a pivot today with the market straddling it several times if the volume is low.
More:
Comex Gold Futures (GC) Technical Analysis – August 13, 2014 …
See which stocks are being affected by Social Media

