
Comex Gold Futures (GC) Technical Analysis – August 18, 2014 …
Get Forex buy/sell signals directly to your email and by SMS.
December Comex Gold futures continued to straddle a pair of 50% levels last week. This type of action indicates trader indecision. Bullish traders are experiencing enough geopolitical concerns and weak economic data to remain relevant. Bearish traders continue to point toward the rally in the global equity markets as the main reason to remain short. Neither side seems willing to budge at this time.
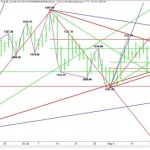
Weekly December Comex Gold
The pivot price resistance is at $1316.30. The pivot price support comes in at $1294.60 and $1287.90. The main trend is up on the daily chart and will remain up until the swing bottom at $1241.70 is taken out. However, the market could sell-off if $1281.00 is taken out with conviction.
Because gold has to breakout eventually in either direction, traders have to watch the order flow to determine if there is strength behind the move. Recent rallies and breaks have failed because they were triggered by buy stops and sell stops rather than fresh buying or selling. The order flow will tell you if there is real buying on the bid or real selling on the offer.
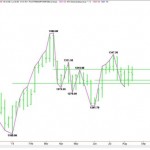
Daily December Comex Gold
The main trend is up on the daily chart. The main range is $1241.70 to $1347.50. Its 50% level at $1294.50 stopped the break on Friday. If it is taken out then look for a test of the Fibonacci retracement level at $1282.10.
The intermediate range is $1347.50 to $1281.00. Its retracement zone is $1314.30 to $1322.10. Its lower or 50% level at $1314.30 provided resistance on Friday. Its upper or 61.8% level at $1322.10 stopped two rallies on August 8 and August 14.
The new short-term range is $1281.00 to $1324.30. Its retracement zone is $1302.60 to $1294.50. The market took out this zone on Friday, but quickly recovered it into the close.
Besides the 50% level at $1294.60, the market found support on a long-term uptrending angle from the $1241.70 bottom. This angle is at $1294.70 today. It also forms a support cluster with a 50% level at $1294.60 and a downtrending angle from the $1347.50 top at $1293.50.
The 50% level at $1302.60 and an uptrending angle at $1303.00 has formed another support cluster. The existence of these support clusters may make a breakdown difficult, but once $1292.00 goes look for an acceleration down to $1282.10.
On the upside, as long as support holds then look for a rally into the 50% level at $1314.30. This is followed by a downtrending angle at $1320.50 and a Fibonacci level at $1322.10.
The daily chart suggests the market can trade in a wide range over the near-term without really going anywhere. Watch the price action inside the triangle formed by an uptrending line at $1292.00 and a downtrending line at $1320.50. The longer the market stays inside this triangle, the greater the strength of the breakout.
Link:
Comex Gold Futures (GC) Technical Analysis – August 18, 2014 …
See which stocks are being affected by Social Media

