
Comex Gold Futures (GC) Technical Analysis – July 21, 2014 …
Get Forex buy/sell signals directly to your email and by SMS.
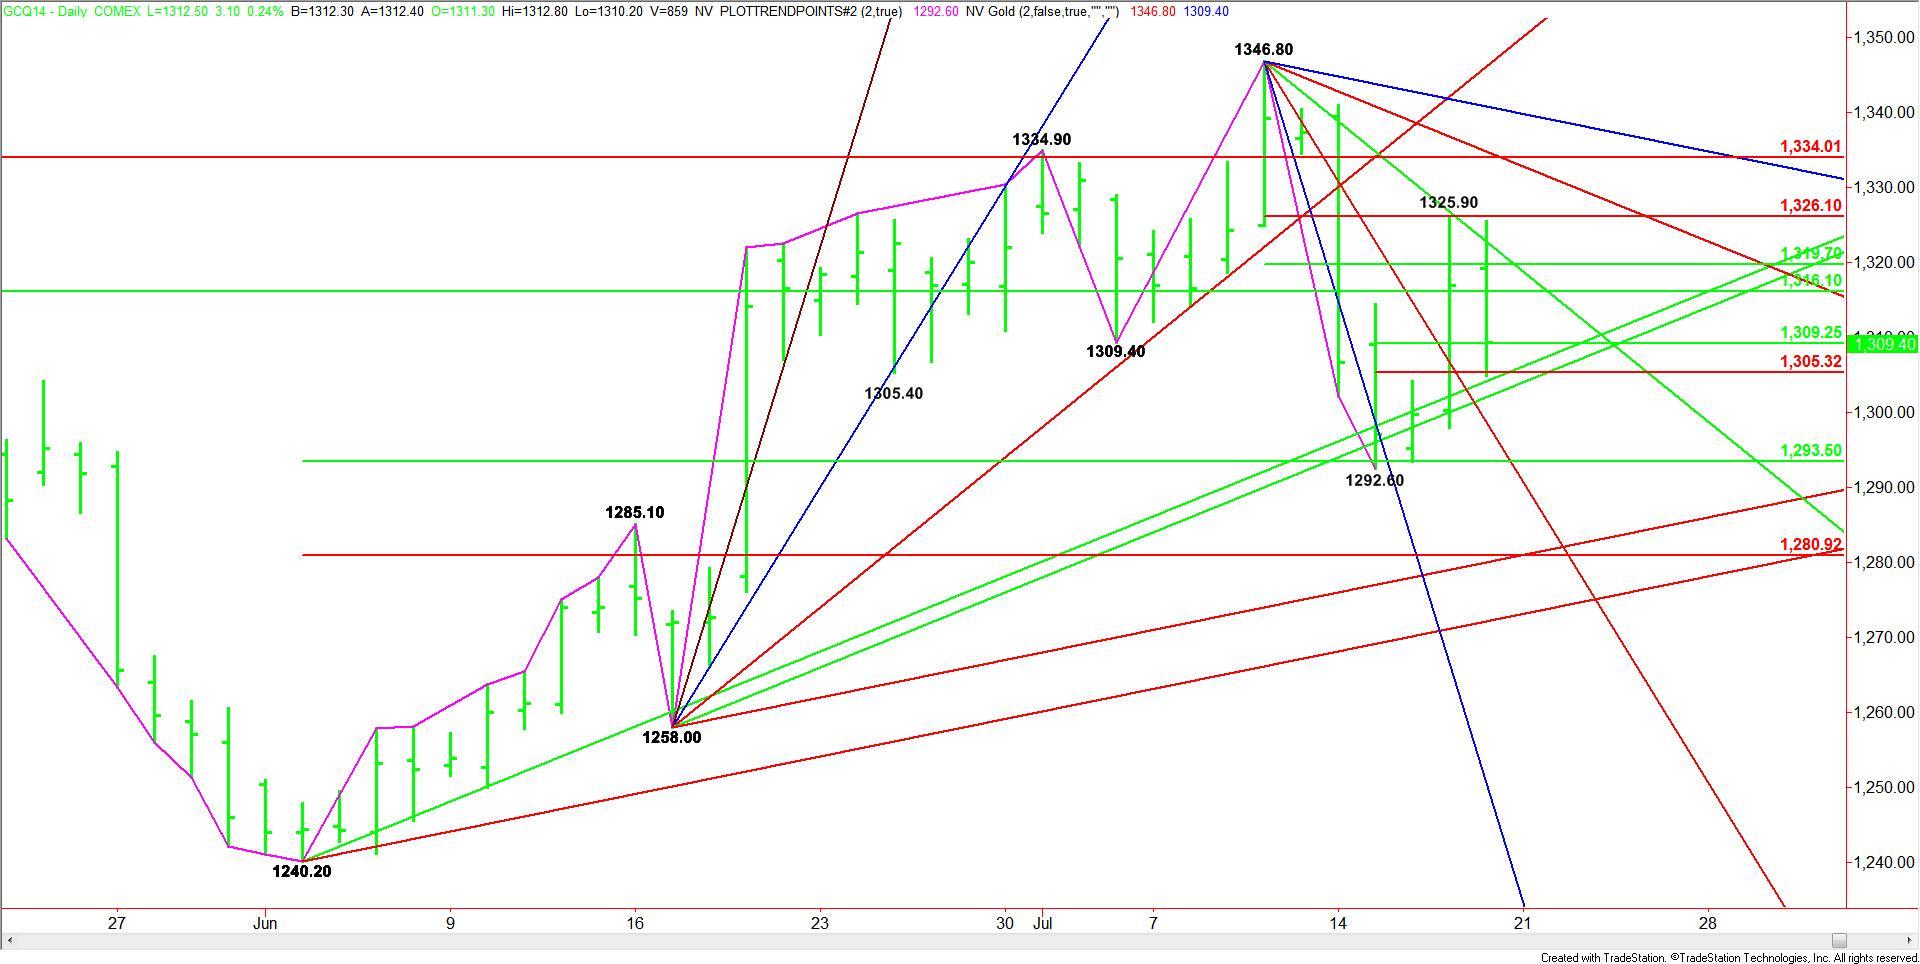
August Comex Gold futures closed lower on Friday after posting an inside move. This chart pattern tends to indicate investor indecision and impending volatility. This means traders should watch for an expanded range over the next couple of days.
Daily August Comex Gold
The main trend turned down on the daily chart last week, but the weakness attracted fresh buying when gold tested the major 50% level at $1293.50. The actual low for the week was $1292.60. The new short-term range is $1346.80 to $1292.60. This range created a retracement zone at $1319.70 to $1326.10. This zone stopped the rally twice on July 17 and July 18 when the market reached $1325.90.
A pair of uptrending angles at $1306.20 and $1304.00 have helped form a triangle chart pattern with a downtrending angle at $1318.80.
The uptrending angles have also formed a support cluster with a short-term Fibonacci level at $1305.30. The downtrending angle has also formed a resistance cluster with the 50% level at $1318.80.
Therefore, the best resistance today is at $1318.80 to $1319.70. Since the main trend is down, sellers are likely to defend this zone. If they fail to stop a rally then look for an extension of the move into $1326.10 the $1334.00.
On the downside, the best support today is at $1306.20 to $1304.00. A failure at this zone could trigger a sharp break since the next support isn’t until $1293.50. The daily chart opens up further under this level with $1280.90 the next likely downside target.
As evidenced by the sell-off on July 14, there is a strong downside bias growing in the gold market. The inability to break through $1292.60 triggered the short-covering rally into the short-term retracement zone at $1319.70 to $1326.10. This is a normal move because the first leg down is usually long liquidation while the second rally draws the attention of the short-sellers.
If a secondary lower-top forms at $1325.90 then look for fresh shorting pressure this week to drive the market through $1292.60 and into $1280.90.
The only way this negative assessment will be negated is if buyers can push the market back through the Fibonacci level at $1326.10.
View original article –
Comex Gold Futures (GC) Technical Analysis – July 21, 2014 …
See which stocks are being affected by Social Media

