
Comex Gold Futures (GC) Technical Analysis – June 27, 2014 …
Get Forex buy/sell signals directly to your email and by SMS.
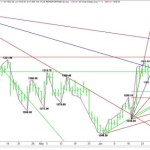
On Thursday, August Comex Gold futures showed signs of weakness early in the session, but short-sellers could not take out the low for the week at $1305.40, causing a short-covering rally into the close. The market also closed over a major 50% level which gives the bulls a little hope that the rally will continue.
Daily August Comex Gold
The main range is $1392.00 to $1240.20. The main retracement zone is $1316.10 to $1334.00. This zone has been providing good resistance all week. The recent rally stopped inside this zone at $1326.60 on June 24. Since then gold has made two attempts to break, but has not been successful. If distribution is taking place then the market will begin to show signs of weakness under $1316.10. Holding this price will indicate the buying is still strong enough to support a rally into the Fibonacci level at $1334.00.
A steep support angle comes in at $1322.00 today. Thursday’s close was below this level means that upside momentum is slowing. If sellers begin to press the market then look for an eventual break into the next angle at $1290.00. Recovering the angle at $1322.00 will be a sign that buyers have returned.
The short-term range is $1258.00 to $1326.60. The retracement zone of this range at $1292.30 to $1284.20 is the next downside target and possible support zone. The lower angle at $1290.00 forms a potential support cluster with the 50% level at $1292.30, making it a valid downside target should there be heavy selling pressure today.
The tone of the market is likely to be determined by how investors react to $1316.10. The market may straddle this number several times today before the buyers or sellers take control.
Excerpt from:
Comex Gold Futures (GC) Technical Analysis – June 27, 2014 …
See which stocks are being affected by Social Media

