
Daily technical analysis – 30 April 2014 | Alpari Newsroom | Live …
Daily technical analysis – 30 April 2014
April 30, 2014
by
in
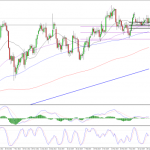
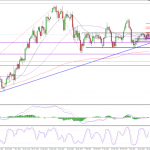
EURUSD
We’ve seen a really strong rally in the pair in the last couple of hours following a negative start to the day. The sell-off saw the 50 fib level – 4 April lows to 11 April highs – once again provide solid support for the pair. While we did see it break below, the failure to close below this level highlights how significant a support level it is. The rally since then has been extremely aggressive and if we see a close above 1.3850, previous resistance, would be a very bullish signal. A break above Monday’s high of 1.3878 would provide additional confirmation of this bullish outlook, with the next major level of resistance coming around 1.3905.
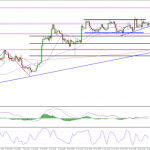
GBPUSD
Cable is yet to see a significant break out from its trading range, although I don’t think it’s too far away. The pair did close above the 1.6840 resistance on the 4-hour chart earlier this week and looked like it was going to push on, but it failed to gain any momentum and before long was back inside the range. This bull trap appears to have simply delayed a move that looks more and more likely to play out. The pair has been making higher lows for the last week or so and is fast approaching that 1.6840 resistance. A close above here would be bullish but following the false breakout on Monday, I’d like to see a clearer close above, with Monday’s highs being broken in the process. Should we see this then the next target will be 1.69, 161.8% fib expansion.
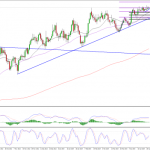
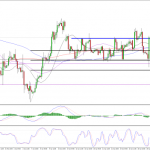
USDJPY
This pair is still stuck within its trading range – 102.28 support and 102.70 resistance – but could be about to breakout to the upside. We’ve seen two occasions in the past when the pair has broken higher only for risk aversion driven by news to pull it lower again (yen favoured as safe haven currency). Now, this could easily happen again but from a technical standpoint, this is once again looking bullish. The pair is making higher lows while finding significant resistance around 102.70. The psychology here is the same as an ascending triangle at the top or the bottom of a trend, which therefore makes it bullish. The fib levels have also been well respected along the way which also makes this bullish. On the most recent retracement, the pair touched the 61.8 fib before aggressively rallying higher. Given the clear respect for this level, I think the expansion levels could be key for support and resistance, as long as we get a close above 102.70. The 61.8 expansion level is just above here around 102.79, followed by the 100 fib expansion level around 103.10.
Author: Craig Erlam
Tagged EUR/USD, foreign exchange trading, forex, forex uk, FX, GBP/USD, Metatrader 4, MT4, MT5, USD/JPY
This article:
Daily technical analysis – 30 April 2014 | Alpari Newsroom | Live …
See which stocks are being affected by Social Media

