
Daily technical analysis – 31 March 2014 | Alpari Newsroom | Live …
Daily technical analysis – 31 March 2014
March 31, 2014
by
in
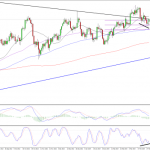
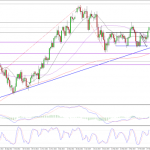
EURUSD
The 50-day SMA and the 50 fib level, 3 February lows to 13 March highs, have combined to provide significant support for the pair over the last couple of days, which could be a sign that the recent weakness has been nothing more than a correction as part of the longer term uptrend. Supporting this bullish view is the divergence seen on the daily chart, with the price action having made new lows on Friday, while the stochastic made higher lows. This is a clear sign that momentum is being lost in the downtrend and is therefore a bullish signal. That said, the pair has not yet taken out last week’s highs and therefore remains in a short term downtrend, having made lower highs and lower lows. A break of this level would be seen as initial confirmation that the uptrend has resumed, with further confirmation from the pair recording higher lows.
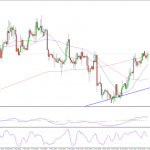
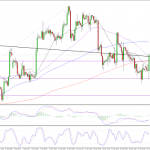
GBPUSD
Sterling is continuing to look bullish after recording five consecutive winning days against the dollar last week. These gains weren’t massive but it did help the pair break back above the 20-day SMA before gapping higher over the weekend. That gap was quickly filled leaving the pair trading lower on the day but above Friday’s close. It is currently finding resistance around 1.6650 but I only expect this to be temporary. So far the pair is showing no sign of reversing lower. Once this level is broken, the pair will have broken above its previous highs and therefore broken out of the downtrend it had been in since the middle of February. The next major resistance levels should now come around 1.6718 followed by 1.6785.
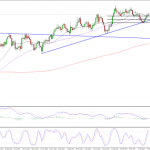
USDJPY
After weeks of trading sideways, the dollar yen pair is finally starting to show signs of life, having finally broken higher. The pair has looked quite bullish for a week or so, since breaking above the flag, but the move has taken longer to materialise than I expected. Based on the size of the entry to the flag and the pole, the pair had two targets, 102.73, which was hit on Friday, and 103.72, which the pair looks likely to hit very soon. A break of this level could then prompt a move back towards this year’s highs of 105.43, with resistance being found along the way around 104.83, 23 January high.
Author: Craig Erlam
Tagged EUR/USD, Fibonacci, Fibonacci Expansion, Fibonacci Retracement, foreign exchange trading, forex, forex uk, FX, GBP/USD, Metatrader 4, Moving Averages, MT4, MT5, Resistance, Support, Trend line, USD/JPY
Link to original:
Daily technical analysis – 31 March 2014 | Alpari Newsroom | Live …
See which stocks are being affected by Social Media

