

Does Earnings Growth Matter When it Comes to Stocks Trading …
Does Earnings Growth Matter When it Comes to Stocks Trading Below Liquidation Value?
By:
| Fri, Jun 20, 2014
The retail public enjoys the storytelling of growth stocks and the financial
press is more than happy to fill that void. It is easy for an investor to fall
into what finance professor, Jeremy Siegel, refers to as a “growth trap”, focusing
on stocks with rapid sales and earnings growth in new industries that are highly
disruptive. Humans have a predisposition to see patterns where none exist.
Connecting the dots and extrapolating above average growth trends far into
the future is an example of this pattern seeking behavior. Let’s take a look
at the evidence and see if past growth in earnings really does continue into
the future for stocks we want to invest in.
My former professor, Dr. Josef Lakonishok, reviewed the performance of stocks
that exhibit above average earnings growth over the recent past and found very
few of them were able to maintain this stellar earnings trajectory. Over the
study period 1951-1997, firms that managed to have a 5 year track record in
the upper 25% in terms of past earnings growth, only around 2% of them went
on to stay above the median firm growth rate during the next 5 year period.[1] Although
the retail public is enamored with growth and is handicapped in seeing growth
patterns where none exist, the evidence doesn’t seem to show an ability to
predict what companies will continue on with above average growth.
Predicting what high growth companies will continue their above average growth
trajectory is difficult. Can we tip the odds in our favor by including additional
filtering rules to be able to predict what high growth companies deliver above
average earnings growth into the future? Unfortunately, additional filters
such as size or book-to-market screens applied to high earnings companies still
fizzle out in terms of delivering those select stocks that continue on with
above average growth into the future. After 4 years, only around 2-3% of high
growth companies that are screened based on size or book-to-market continue
to stay above the median growth rate in terms of earnings. Practically none
of these companies still maintain a sales or earnings growth rate above the
median after a decade.[2]
So what if the earnings growth dwindles over time for companies that produced
above average growth in the recent past. If they outperform the broad market
average, aren’t they still worth buying? Not if you use only earnings-per-share
growth as your buying criterion. O’Shaughnessy in his book, What Works on
Wall Street, showed that a portfolio of 50 stocks with the highest previous
5 year earnings-per-share growth rate lagged the market over a 50 year study
period. Even breaking down the long study period into rolling 5 year periods,
growth companies still lagged the broad market average most of the time.[3]
So in summary, earnings growth can’t be predicted and purchasing historical
high growth stocks doesn’t seem to outperform the market over the long term.
What should investors do in terms of a rationale process that would be a better
use of their investment capital. The answer is invest in stocks trading below
liquidation value and abandon the earnings forecasting game all together.
By focusing your data mining activity not on the income statement, but on
the balance sheet of public companies, a better performance result is delivered.
A selection criterion outlined by value investing pioneer, Benjamin Graham,
called for purchasing stocks trading below net current asset value, an approximate
measure of the liquidation value of a public company. This criterion calls
for subtracting all liabilities including preferred stock from the current
assets listed on a company’s balance sheet. If this measure of liquidation
value of a company is significantly greater than the market value, purchase
the stock.
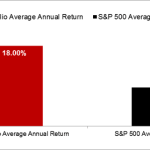
Below shows the average performance of stocks trading below 75% of net current
asset value over the 1956-2009 study period. No more than 10% was invested
in any one stock. If only a few stocks were available that met this stringent
value investing criterion, the balance of the portfolio remained in Treasury
Bills. As indicated on the graph, even with a portion of the portfolio being
handicapped by sitting idle in Treasury Bills, the long term performance is
excellent relative to a broad market average.
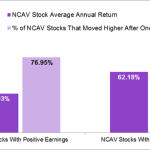
We know that stocks trading below liquidation value have good historical performance
regardless whether earnings are positive or negative. The chart below looks
at all stocks trading below 75% of net current asset value and divides them
into two groups: ones with positive earnings over the previous year and the
others with negative earnings. Both groups perform well, but the ones with
earnings losses over the previous year perform even better. This same conclusion
is also supported in another study by Tobias Carlisle and his colleagues showing
monthly returns of negative earnings companies that trade below 2/3rds of net
current asset value outperform ones with positive earnings.[4]
Unfortunately, the superior performance of net current asset value stocks
that lost money over the previous year comes with a price. As the chart shows,
a smaller percentage of stocks trading below net current asset value with negative
earnings increased their share price after a year. Average annual returns are
better for NCAV stocks that lost money in the past year, but only 57% of them
moved higher in price.
For investors willing to embrace a value investment philosophy and purchase
only stocks trading below net current asset value, it is better to focus on
the balance sheet of a company rather than earnings summarized on the income
statement. Stocks whose most liquid assets on the balance sheet exceed all
liabilities manage to outperform the broad market average over the long study
period from 1956-2009. Earnings growth is not only difficult to predict in
the future, but as a stand alone selection criterion it doesn’t add much value
in terms of superior portfolio performance. The long term evidence shows that
selecting stocks trading below net current asset value is a better use of your
time and energy than chasing the next earnings momentum stock touted by the
financial press.
[1] Louis K. C. Chan,
Jason Karceski and Josef Lakonishok. “The Level and Persistence of Growth Rates.” Journal
of Finance 58, no. 2 (April 2003): 660-661.
[2] Louis K. C. Chan,
Jason Karceski and Josef Lakonishok. “The Level and Persistence of Growth Rates.” Journal
of Finance 58, no. 2 (April 2003): 656.
[3] James P. O’Shaughnessy,
What Works on Wall Street, (New York: McGraw-Hill, 1998), 191-196.
[4] Tobias Carlisle, Sunil
Mohanty and Jeffrey Oxman. “Ben Graham’s Net Nets: Seventy-Five Years Old and
Outperforming.” February, 2010. Accessed June 10th, 2014. http://eyquemdotnet.files.wordpress.com/2013/09/benjamin-grahams-net-nets-seventy-five-years-old-and-outperforming-full-tables1.pdf.
Please enable JavaScript to view the comments powered by Disqus.
Author: Victor Wendl
Victor J. Wendl
President
wendlfinancial.com
Important Disclosure: Victor Wendl is the author of The Net Current
Asset Value Approach to Stock Investing. The book reviews the performance
over a 60 year time period of purchasing stocks trading below net current
asset value. The stock filtering criterion was popularized by Benjamin Graham,
the father of value investing, and a mentor to Warren Buffett who considered
his professor and former employer one of the most influential people in his
life. The Net Current Asset Value Approach to Stock Investing is available
for purchase on Amazon.com,
as well as for Nook and Kindle reading
devices.
Wendl Financial, Inc. is registered as an investment adviser with the state
of Missouri and only conducts business in states where it is properly registered,
or is excluded or exempted from registration requirements. Registration as
an investment adviser does not constitute an endorsement of the firm by securities
regulators. The information in this article is for general information purposes
only and should not be construed as personalized investment advice.
You must be aware of the risks and be willing to accept them in order to invest
in the stock market. Don’t trade with money you can’t afford to lose. This
is neither a solicitation nor an offer to buy stocks. No representation is
being made that any account will or is likely to achieve profits or losses
similar to those discussed on this Web site. The past performance of any trading
system or methodology is not necessarily indicative of future results. No representation
is being made that any account will or is likely to achieve profits or losses
similar to those shown.
Past performance results is not an indication of future performance. Wendl
Financial shall have no liability of whatever nature in respect of any claims,
damages, loss, or expense arising out of or in connection with the reliance
by you on the contents of our website.
Copyright © 2014 Victor Wendl
All Images, XHTML Renderings, and Source Code Copyright © Safehaven.com
Read the article –
Does Earnings Growth Matter When it Comes to Stocks Trading …
See which stocks are being affected by Social Media

