
E-mini NASDAQ-100 Index (NQ) Futures Technical Analysis …
Get Forex buy/sell signals directly to your email and by SMS.
On Tuesday, September E-mini NASDAQ-100 Index futures straddled a key retracement zone as bullish investors tried to establish a new support area. Since the main trend is down on the daily chart, establishing a new higher bottom has been a struggled because of the increased presence of short-sellers.
Unless enough buyers can come in to defend this zone, it looks as if the downside momentum is strong enough to take the market lower. Overvalued equities may be keeping investors on the sidelines and encouraging profit-taking which usually means the index will go down until it reaches a value zone.
Timing may also be an issue. Since the Fed is not going to meet until late September and the economy continuing to pump out mixed signals, investors may decide to pare positions and sit on the sidelines until after the traditional ending of summer on Labor Day in early September.
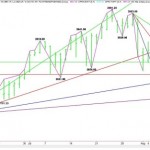
Daily September E-mini NASDAQ-100 Index
The main range is 3744.75 to 3991.25. The retracement zone created by this range is 3868.00 to 3839.00. Traders have been trying to establish support inside this zone since late last week. If buyers can defend this zone and sustain a move over the 50% level at 3868.00 then look for a rally into an uptrending angle at 3896.75 or a downtrending angle at 3903.00.
Overcoming and holding 3868.00 will be the first sign of buying, overtaking 3896.75 will be the next. However, don’t look for an acceleration to the upside unless 3903.00 is taken out with conviction.
A failure to hold 3868.00 will indicate the presence of sellers. If short-sellers come in to press the index then look for a drive into the Fibonacci level at 3839.00.
The triggering of sell stops and aggressive shorting may take place under 3839.00. If this level is violated then look or a possible drive into uptrending angles at 3820.75 and 3782.75.
The initial tone of the day will be determined by investor reaction to 3868.00. If there is no downside momentum generated by this move then look for a sideways trade inside 3868.00 to 3839.00. This will indicate trader indecision.
This article is from:
E-mini NASDAQ-100 Index (NQ) Futures Technical Analysis …
See which stocks are being affected by Social Media

