
E-mini Russell 2000 Index (TF) Futures Technical Analysis – April …
Get Forex buy/sell signals directly to your email and by SMS.
The trading action has been limited and volume low during the overnight session, but the June E-mini Russell 2000 Index is still managing to hold on to a small gain. With the index within striking distance of a key retracement zone, investors are going to have to decide whether to buy strength through this zone or play for a retracement of the current rally from 1090.80.
Daily June E-mini Russell 2000 Index
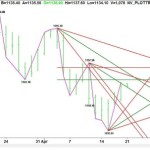
The main trend is down on the daily chart. A trade through the swing top at 1157.50 will turn the main trend to up. The main range is 1191.10 to 1090.80. Making its retracement zone at 1141.00 to 1152.90 the next upside target.
The first target today is a steep uptrending angle at 1138.80. Overcoming this angle will put the market in a position to challenge the 50% level at 1141.00. Holding above this angle should send the index into a pair of angles at 1145.50 and 1147.10. Overcoming these angle should lead to a test of the Fibonacci level at 1152.80.
A failure to overcome the angle at 1138.80 will be the first sign of weakness. Crossing over to the bearish side of a downtrending angle at 1133.50 will be the next sign of selling pressure. The market opens up under this angle with 1114.80 the next potential target.
Watch the volume on a test of 1138.80 early in the session. If buyers show up then look for a breakout through this level. If the sellers dominate at this price then look for a bearish tone today.
Continued here:
E-mini Russell 2000 Index (TF) Futures Technical Analysis – April …
See which stocks are being affected by Social Media

