
E-mini S&P 500 Index (ES) Futures Technical Analysis – July 7 …
Get Forex buy/sell signals directly to your email and by SMS.
September E-mini S&P 500 Index futures closed at a new all-time high on July 3. Look for traders to extend this move today. Although the price action indicates further upside action is likely, traders should still watch for potential signs of a top since the market is in the window of time for a closing price reversal top and overbought according to some technical oscillators and indicators.
It’s not suggested you try to pick the top by selling new highs, but rather watch for intraday reversals or “M” formations to indicate the selling may be greater than the buying at current price levels.
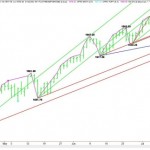
Daily September E-min S&P 500 Index
The close at 1977.50 has put the index on the weak side of a pair of uptrending angles at 1981.50 and 1984.25. Overcoming these angle will put the market in an extremely strong position with 1991.75 the next likely upside target. Watch for an acceleration to the upside if this level is taken out with conviction.
A failure to overcome 1981.50 will be a sign of selling pressure. This could lead to profit-taking and aggressive counter-trend shorting pressure. The daily chart indicates there is plenty of room to the downside with 1960.25 the first potential downside target.
The major angles today are 1949.50 and 1948.25. Taking out these angle with conviction will weaken the uptrend and put the market in a position to change the trend to down on a move through 1936.25.
Original article –
E-mini S&P 500 Index (ES) Futures Technical Analysis – July 7 …
See which stocks are being affected by Social Media

