
E-mini S&P 500 Index (ES) Futures Technical Analysis – June 23 …
Get Forex buy/sell signals directly to your email and by SMS.
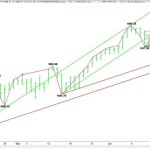
September E-mini S&P 500 Index futures posted a new contract high last week as well as a strong gain for the week. The close near the high for the week puts the market inside the uptrending channel that provided direction for the index throughout the month of May and the early part of June.
Daily September E-mini S&P 500 Index
The support for the channel is an angle moving up 4 points per day from the 1851.75 bottom at 1955.70 today. A sustained move over this angle will be bullish. The upper end of the channel comes in at 1988.50.
If the trend cannot be maintained over the angle at 1955.70 then this angle may become the upper end of another uptrending channel. This channel’s support is 1945.50.
The current short-term range is 1917.50 to 1959.75. If sellers gain control and the index begins to break then look for a pull-back into 1938.50 to 1933.50.
The Volatility Index or VIX is extremely low and indicating investor complacency. This is how sell-offs begin, especially the surprise variety. The military activity in Iraq could be this year’s wildcard. Watch for signs of a top and if they occur, Investors should turn a little defensive.
The earliest signs that the selling is greater than the buying will be an “M” top or closing price reversal top on the hourly chart, followed by a closing price reversal top on the daily chart.
Original post:
E-mini S&P 500 Index (ES) Futures Technical Analysis – June 23 …
See which stocks are being affected by Social Media

