
GBP/USD- Technical Analysis – FX-Insights
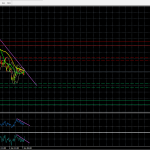
The GBP/USD is trading below the downward trend line on a 30 minute time frame. However, the pair is challenging this downward trend line and there is a strong possibility that the price may be able to break this resistance because it is trading above the 50day (shown in green) and the 100 day (shown in yellow) moving average which means that the bulls have taken the control.
The RSI is trading in line with the price action which means that the longer term bias still could be to the downside.
Important Zones
Resistance Zone
1.6558-1.6539 Major
1.6473-1.6454 Minor
Support Zone
1.6332-1.6310 Minor
1.6238-1.6219 Major
Share this:
FacebookLinkedInPinterestEmailMoreGoogleTumblrRedditDiggStumbleUponPrint
Link –
GBP/USD- Technical Analysis – FX-Insights
See which stocks are being affected by Social Media

