
GDP & Stock Market Returns (DJIA) | Seeking Alpha
Editor’s note: Article originally published on May 19, 2014
Today I want to examine the relationship between Gross Domestic Product (GDP) and stock market returns. The purpose will be to determine if periods of strong economic growth correlate to strong stock market returns. Does looking at the macro economic data help or hinder you as an investor?
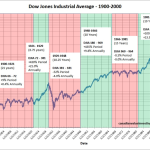
Let’s look at the data for the 20th century. To begin we will examine stock market returns from 1900-2000. For our purposes we will use the Dow Jones Industrial Average (DJIA), a common market index, as our proxy for overall market returns*. It is one of the only indexes that has data going back that far.
The first thing we notice from the graph is that stock markets over this 100 year period can be divided into six distinct periods of time. The red highlighted periods indicate flat or down markets. The green highlighted periods indicate upward or bull markets.
The periods 1900-1921, 1929-1948, & 1966-1981 all saw flat or declining stock prices. These were fairly long periods of time ranging from 15-21 year in length. These flat markets accounted for 54.25 years.
The periods 1921-Fall 1929, 1948-1966, & 1981-2000 all saw huge bull markets for the stock market. These periods ranged in length from 8.75 years to 19 years. The stock market gained between 9.8% to 21% annually over these periods. These bull markets accounted for 45.75 years.
Let’s breakdown and look at the economic growth for each period of the above periods highlighted both red and green in the graph above.
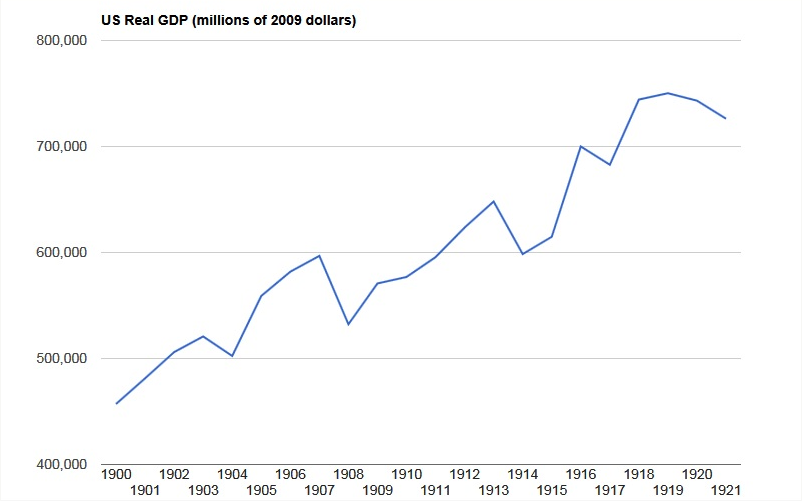
1900-1921
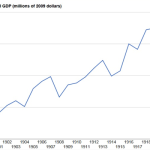
The first time period was from 1900 until 1921. So what did GDP do during this period**?
It wasn’t exactly smooth growth but for the entire period real GDP grew from $457 billion to $726 billion (all figures in 2009 dollars). For this period GDP increased 59% or 2.2% annually. Stock market increased by only 9% or 0.4% annually.
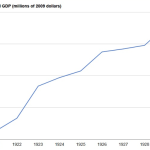
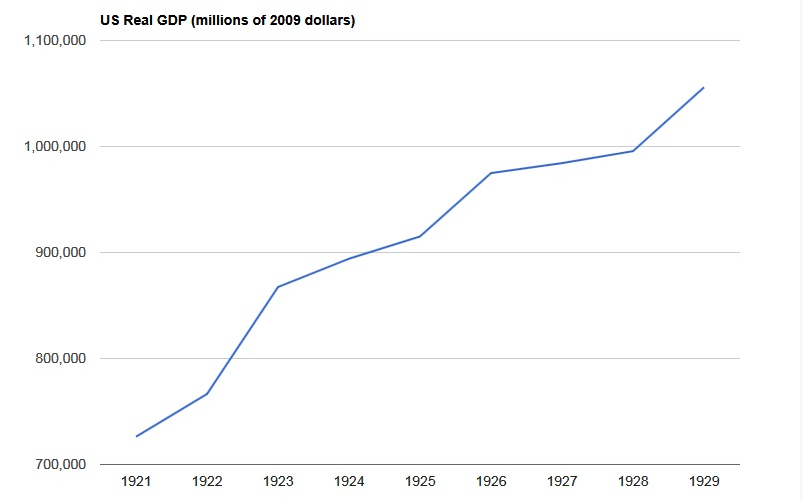
1921 – Fall 1929
The second period was from 1921 to the fall of 1929, shown below.
During this time period the growth was consistently up with no down years. Real GDP increased from $726 billion to $966 billion (end of period data used). During this 9 year period GDP increase 33% or 3.2% annually. In contrast, the stock market was on fire, increasing 430% or 21.0% annually.
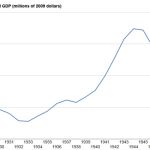
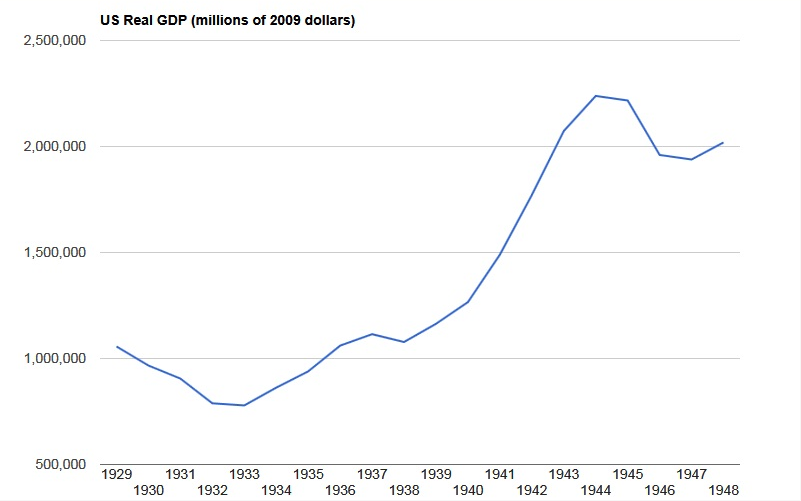
Fall 1929 – 1948
The third period began with the Great Depression in the fall of 1929 lasted until 1948. GDP shown below.
This period began with a serious decline in real GDP (the Great Depression), but then growth rebounded. Real GDP increased from $966 billion to $2,018 billion. During this 18.25 year period real GDP increased 109% or 4.2% annually. In contrast, the stock market went into a deep slump losing just over half if its value (-52%) or -4.0% annually.
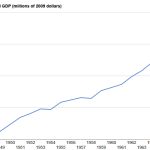
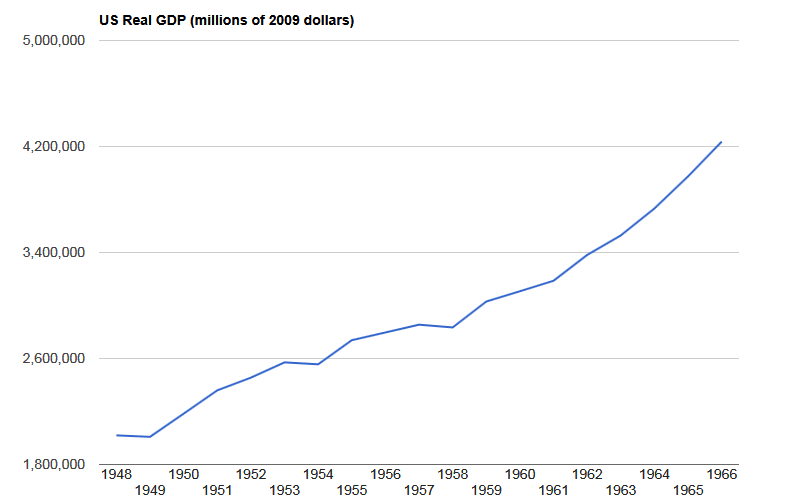
1948 – 1966
The fourth period was from 1948 and lasted until 1966. GDP shown below.
This period saw solid growth, once again, with a few down years. For the entire period real GDP increased from $2,018 billion to $4,235 billion. During this 18 year period real GDP increased 110% or 4.2% annually, almost exactly the same as the previous period. The stock market finally woke up to the strong growth. The DJIA increased from 181 to 969, increasing 435% or 9.8% annually.
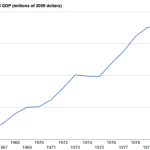
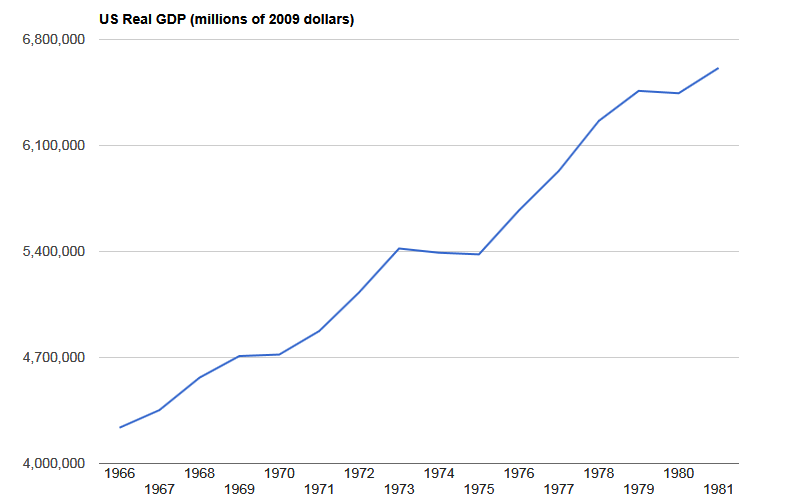
1966 – 1981
The fifth period was from 1966 and lasted until 1981. This period was marked by high inflation and other worries. GDP shown below.
This period again saw solid growth again with a few down years. For the entire period real GDP increased from $4,235 billion to $6,611 billion. During this 15 year period real GDP increased 56% or 3.0% annually. The stock market however went into hibernation during this time. The DJIA was essentially flat with the DJIA falling slightly from 969 to 964. This equates to a 0.5% decrease for the entire period, or -0.0% annually.
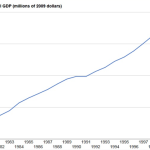
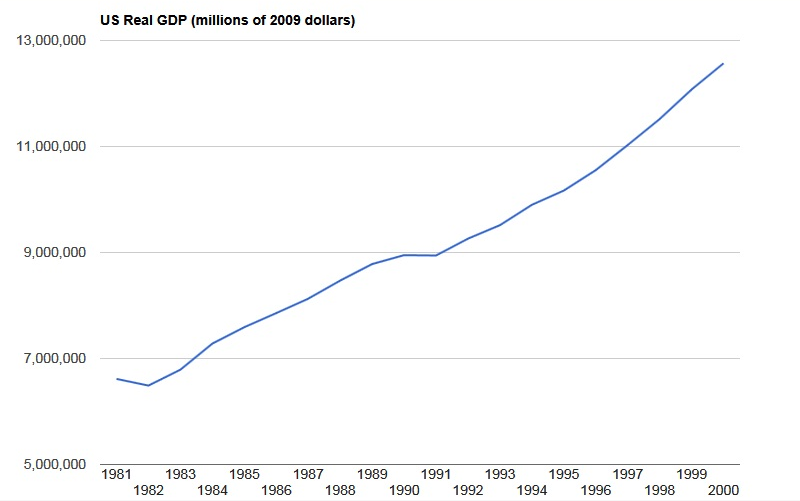
1981 – 2000
The sixth period was from 1981 and lasted until 2000. GDP shown below.
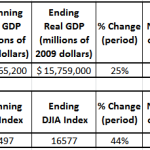
This period began with a slight recession but once again saw solid growth. For the entire period real GDP increased from $6,611 billion to $12,565 billion. During this 19 year period real GDP increased 90% or 3.4% annually. The stock market once again resumed its upward march. The DJIA increased from 964 to 11,497 during this time. This was the longest bull market during the 20th century with the index increasing 1093% or 13.9% annually.
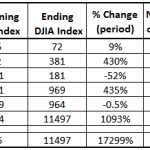
To summarized the data, here is the results for the DJIA for each of the six periods.
Taken on a whole, the DJIA increased from 66 to 11497 from 1900-2000. During that time the DJIA rose 173 fold or 5.3% annually.
The DJIA saw a total of 54.25 years of flat or declining values. Remarkably the DJIA recorded all of its gains over a period of 45.75 years, or less than half of the time. While economic growth was fairly constantly upward, the returns of the stock market were anything but steady.
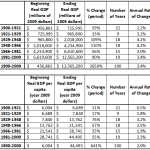
Here is a summary of the data for both real GDP (top table) and real GDP per capita (bottom table) for all six time periods.
From the top table we can see that for the entire period real GDP grew 26.5 fold or 3.4% annually. The first thing we can notice is that there was economic expansion during each of the six time periods. While the growth was strong in some periods and weaker in others, overall it was fairly consistent in the 2-4% range.
Out of curiosity I also calculated the numbers for real GDP per capita (the bottom table). Due to population growth, real GDP per capita increased by 6.4 times during the 20th century or 2.0% annually.
What I find ironic is that the highest level of real GDP per capita growth was during 1929 to 1948 where it increased by 3.2% annually. This was a time when the stock market was cut in half but the standard of living increased immensely***.
Conclusion
So what conclusions can be drawn from this? Over the entire century, 1900-2000, real GDP grew at 3.4% annually and the stock market gained 5.3% annually. As a whole, real GDP increased slowly and steadily between 2 to 4%. The same can’t be said for the stock market. Over that same time period the stock market was flat or down 54.25% of the time, while the stock market was up only 45.75% of the time.
Don’t count on macro economic data to help you out in determining where the markets will head next year or next month.
What about GDP and DJIA returns since 2000?
Here is the data here for your reference and amusement.
Remarkably, the DJIA was flat for the first 12 years and has only started to rise since late 2012. History seems to be repeating itself all over again. If the stock market rises 5.3% annually during the 21st century, the DJIA will reach 41,811 by 2025, 152,055 by 2050, and 2,011,044 by 2100.There will be a few new 52 week highs from the current DJIA level of 16,512.
* DJIA Data Source: Samuel H. Williamson, “Daily Closing Values of the DJA in the United States, 1885 to Present,” MeasuringWorth, 2014
** US GDP Data Source: Samuel H. Williamson, “What Was the U.S. GDP Then?” MeasuringWorth, 2014.
***Standard of living is commonly measured by growth in real GDP. While this may be one indicator of our standard of living, it is not a complete measure. Today, many items we enjoy are free and some items have fallen in price yet have much higher quality and features than previous models and this is not reflected in standard GDP calculations.
Source:
GDP & Stock Market Returns (DJIA)
See original article:
GDP & Stock Market Returns (DJIA) | Seeking Alpha
See which stocks are being affected by Social Media

