

GOLD Elliott Wave Technical Analysis – 27th December, 2013 | Lara …
GOLD Elliott Wave Technical Analysis – 27th December, 2013
By:
| Sat, Dec 28, 2013
Last analysis expected a fourth wave correction may have been complete. A
trend channel was provided for confirmation. We did not get confirmation and
price moved higher, remaining just below the invalidation point.
The wave count is mostly the same.
Gold is still within a large fourth wave correction at primary wave degree
which is incomplete. To see a full explanation of my reasoning for expecting
that primary wave 4 is not over and is continuing see this.
Primary wave 2 was a rare running flat correction, and was a deep 68% correction
of primary wave 1. In order to show alternation in structure primary wave 4
may be a zigzag, double zigzag, combination, triangle or even an expanded or
regular flat. We can rule out a zigzag because the first wave subdivides as
a three. This still leaves several structural possibilities.
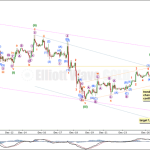
The downwards wave labeled intermediate wave (B) is now over 90% the length
of the upwards wave labeled intermediate wave (A). Primary wave 4 may be a
flat correction, but it may also still be a combination or triangle as there
are still several different structural possibilities.
At 1,167.73 intermediate wave (B) would be 105% the length of intermediate
wave (A), and primary wave 4 may be an expanded flat correction. Expanded flats
normally have C waves which move substantially beyond the end of the A wave,
and which are often 1.618 and sometimes 2.618 the length of the A wave. If
1,167.73 is reached and passed then the subsequent upwards wave for intermediate
wave (C) may reach well above 1,433.83.
Within minor wave C there was no Fibonacci ratio between minute waves iii
and i. This makes it more likely we shall see a Fibonacci ratio exhibited between
minute wave v and either of i or iii. At 1,159 minute wave v would reach equality
in length with minute wave iii. This lower target allows enough room for minute
wave v to complete.
Downwards movement has breached the parallel channel drawn about intermediate
wave (B) downwards, and it has found support at the next trend line.
Draw a parallel channel about minor wave C downwards with the first trend
line from the highs labeled minute waves ii to iv, then place a parallel copy
upon the low labeled minute wave iii. Downwards movement is finding support
at the lower edge of this channel.
When the channel about intermediate wave (B) is finally breached by upwards
movement then I would consider that final confirmation that intermediate wave
(C) is underway.
Primary wave 4 may not move into primary wave 1 price territory. This wave
count is invalidated with movement above 1,532.90.
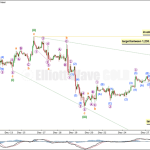
Main Hourly Wave Count.
Minuette wave (iv) has moved higher, and we still do not have trend channel
confirmation that it is over. There is almost no room left for upwards movement,
and so it must be over if this wave count is correct.
At the daily chart level this main hourly wave count has a better look than
the alternate below.
I want to see movement below the parallel channel containing minuette wave
(iv) to have confidence that it is over. A full hourly candlestick below the
channel and not touching the lower trend line would provide a clear channel
breach.
While price remains within this channel the alternate hourly wave count below
must be considered.
At 1,155 minuette wave (v) would reach equality in length with minuette wave
(iii). This gives us a smaller $4 target zone.
Minuette wave (iv) may not move into minuette wave (i) price territory. This
wave count is invalidated with movement above 1,220.65.
If this main hourly wave count is invalidated then the alternate hourly wave
count below should be used.
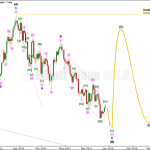
Alternate Hourly Wave Count.
There are two structural possibilities for a fifth wave. The main hourly wave
count above looks at the more common structure of an impulse for minute wave
v, and this alternate looks at the less common structure of an ending diagonal.
At the daily chart level this alternate wave count does not have the right
look; ending diagonals normally have very obvious zigzags for subwaves 1, 3
and 5. On the daily chart for this ending diagonal minuette waves (i) and (iii)
look like impulses and do not look like zigzags.
Within an ending diagonal all the subwaves must subdivide as zigzags. Diagonals
are the only structures where you will see a third wave labeled as a zigzag.
Within a diagonal the second and fourth waves most commonly end between 0.66
and 0.81 of the prior subwave. Within this possible diagonal minuette wave
(ii) was a 0.66 correction of minuette wave (i). Minuette wave (iv) would be
between 0.66 and 0.81 the length of minuette wave (iii) between 1,230.10 and
1,239.82.
This wave count eliminates the problem of proportions within minuette wave
(iii); this downwards movement subdivides nicely as a zigzag.
Within minuette wave (iv) subminuette wave a is remarkably short, and this
reduces the probability of this wave count slightly. However, a bigger problem
is within the structure of subminuette wave c: micro wave 3 must subdivide
as an impulse and the only way this works is to see submicro wave (1) ending
at 1,201.74 so that submicro wave (3) is not the shortest wave. If submicro
wave (1) ends there then on the five minute chart it does not subdivide into
a five wave structure. I will allow for the possibility that my analysis of
this piece of movement may be wrong.
Within the diagonal minuette wave (iv) must overlap into minuette wave (i)
price territory; this wave count requires movement above 1,220.65.
Within the diagonal minuette wave (iv) may not move beyond the end of minuette
wave (ii). This wave count is invalidated with movement above 1,252.12.
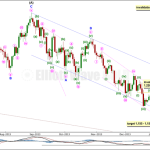
Alternate Daily Wave Count – Triangle.
It is also possible that primary wave 4 may continue as a regular contracting
(or barrier) triangle.
A new low below 1,180.40 is also possible for this wave count if the triangle
is a running triangle, as about 40% of triangles are.
The expected direction and structure of this next upwards wave is the same,
but for this alternate intermediate wave (C) of the triangle may not move beyond
the end of intermediate wave (A). The triangle is invalidated with movement
above 1,438.83.
The final intermediate wave (E) upwards may not move above the end of intermediate
wave (C) for both a contracting and barrier triangle. E waves most commonly
end short of the A-C trend line.
All five subwaves of a triangle must divide into corrective structures. If
this next upwards movement subdivides as a zigzag which does not make a new
high above 1,438.83 then this alternate would be correct.
Triangles take up time and move price sideways. If primary wave 4 unfolds
as a triangle then I would expect it to last months rather than weeks.
Please enable JavaScript to view the comments powered by Disqus.
Author: Lara Iriarte
Lara Iriarte
elliottwavegold.com
Elliott wave is one of the more difficult and complicated technical analysis
tools. When done right it can be uncannily accurate.
I have been using the Elliott wave principle to analyse up to five markets
a day since 2008. I began Elliott Wave Forex (originally ForexInfo.us) in
2009 to provide daily analysis of EURUSD and GBPUSD, then I began Elliott
Wave Stock Market in 2010. Elliott Wave Gold began in August, 2013. Currently
I provide daily analysis of Gold on this site, and daily analysis of the
S&P 500 on Elliott Wave Stock Market for its members.
I have a science background (BSc) which has trained me to think logically
and be evidence focussed. Over the years I have seen no market movement which
does not fit into the clear and restrictive rules for Elliott wave structures.
I have members who are fund managers, institutional investors and professional
traders.
If you want to learn how to apply the Elliott wave principle to any market
my analysis service is designed to teach you, daily, how to do this.
Copyright © 2013 Lara Iriarte
All Images, XHTML Renderings, and Source Code Copyright © Safehaven.com
Read this article –
GOLD Elliott Wave Technical Analysis – 27th December, 2013 | Lara …
See which stocks are being affected by Social Media

