
Guide to Stock Market Corrections | The Big Picture
The S&P 500 hit 1709 a few weeks back and has since been dropping precipitously, we are now down roughly 3.7% from that level in a short period of time. Heading into today, we’ve been negative 4 days straight and have seen losses during 9 of the last 11 days on both the S&P 500 and the Dow Jones Industrial Average.
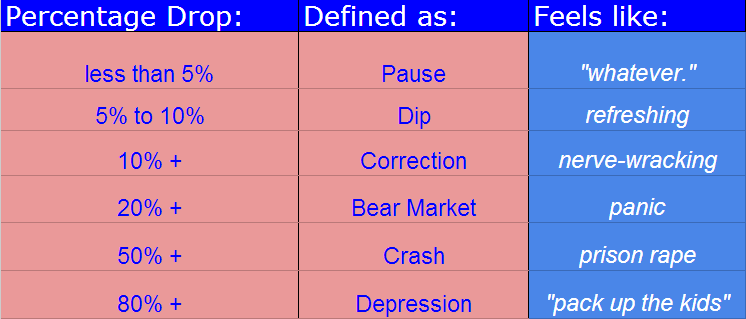
Suddenly, everyone is talking about this being a correction. I would say that at the current moment, we are just barely in a dip but possibly headed toward a correction. Let’s first define some terms:
With a market pause that is not yet even a 5% dip – let alone a 10%+ correction – people (myself included) have been jumping the gun in trotting out the C-word so early.
But for argument’s sake, let’s say we’re headed for a real correction…what should we expect? Today I’ll limit my remarks to price action and not get started into a whole discussion about news, valuations, or anything else.
A handy field guide to stock market corrections below (data via Dow Jones, Morningstar, Bloomberg):
* Since the end of World War II (1945), there have been 27 corrections of 10% or more, 12 of which had turned into full-blown bear markets (with losses of 20% +).
* This equates to one correction roughly every 20 months, according to Dow Jones index maven John Prestbo, who points out that this average does not mean they’re evenly spaced out. 25% of these corrections over the last 66 years occurred during the 1970′s (the Golden Age of Market Timers), another 20% occurred during the secular bear market of 2000-2010.
* The average decline during these 27 episodes has been 13.3% and they’ve taken an average of 71 days to play out (just over three months).
* From the beginning of the last secular bull market in 1982 through the 1987 crash, there was just one correction of 10% or more. Between the Crash of 1987 and the secular bull market’s peak in March 2000, there were just two corrections, according to Ed Yardeni. This means that secular bull markets can run for a long time without a lot of drama.
* Since the stock market’s bottom in March of 2009, there have been only 3 corrections: In the spring of 2010 the S&P 500 began a 69-day drop of roughly 16%. The widely referenced summer correction of 2011 lasted for about 154 days and almost became a bear market. The correction during the spring of 2012 set up one of the greatest rallies of all time, although it was barely a real correction, sporting a peak-to-trough drop of just 9.9% in just under 60 days.
* The most recent correction took place in 2011, between the end of April into the end of September. The Dow dropped roughly 16%. The S&P 500 actually dropped a hair over 20% before snapping back, leading some to believe that this was a bear market – the implication being that the current bull market is just 2 years old and not five years old (dating from March of 2009). I have no strong opinion on that debate.
* Bull market rallies in between corrections – and there have been 58 in the post-war period – tend to run for an average of 221 trading days before being interrupted and gaining an average of 32%. By this standard, we are way overdue for a correction (but in fairness, we have been for awhile).
* As to what we should do during corrections, I’d recommend maintaining a list of high-quality stocks you’ve been kicking yourself for missing out on and clearing the decks of any longs you don’t truly love. For those with time horizons longer than five years (most), the best thing to do is grit one’s teeth and do very little. If a correction of between 10 and 20% is unbearable to you mentally or financially, that means you’ve either got more money than you should invested in stocks or you’re kind of a fairy. Make the adjustment you can live with and remember this feeling the next time you find yourself chasing the market.
* As to the question of whether a correction could become a bear market (or worse even, a crash), the answer is that this is always possible. But most corrections do not become crashes, and every single one of them turned out to have been great buying opportunities in the fullness of time.
* Lastly, remember your ABC’s: Always Be Cool.
Category: Cycles, Investing, Trading
← Unless the Fed Goes Cold Turkey on Us, Expect a Bountiful Economic Harvest for Thanksgiving 2014
Leave a Reply
You must be logged in to post a comment.
View original:
Guide to Stock Market Corrections | The Big Picture
See which stocks are being affected by Social Media

