
Here's what the rally in biotechs looks like compared to the tech bubble (QQQ, IBB, IXIC, XBI)

Mar. 23, 2015, 2:21 PM
0
Biotech stocks are on fire.
That’s given some analysts flashbacks of 2000, when tech valuations were red hot, but it didn’t end well because they crashed.
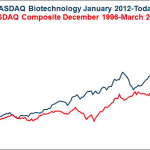
Michael Batnick over at The Irrelevant Investor posted this chart Monday that compares the rally in tech stocks then to biotechs in recent years.
He describes the biotech rally:
“In the 168 weeks since the beginning of 2012, the NASDAQ Biotech Index has advanced 250%. In the 168 weeks leading up to the peak of the dot-com bubble, the NASDAQ Composite gained 290%. While the Biotech stocks have had a monster run and are approaching the dot-com gains, the rate at which they accelerated is peanuts compared to the tech stocks.”
This isn’t to say that the bull run will end like it did in 2000, he notes, and some analysts are calling for a breather.
On Monday, the ‘IBB’ ETF that tracks the biotech sector was a major laggard, falling about 2% while markets were broadly higher.
Here’s the chart.
NOW WATCH: Nationwide’s Super Bowl commercial about dead children is about corporate profits … in a way that we can all appreciate
Please enable Javascript to watch this video
View this article:
Here's what the rally in biotechs looks like compared to the tech bubble (QQQ, IBB, IXIC, XBI)

