

How Do Net Current Asset Value Stocks Perform When Buffett's …
How Do Net Current Asset Value Stocks Perform When Buffett’s Favorite Valuation Indicator is Expensive
By:
| Tue, Jun 3, 2014
Warren Buffett, a former student and employee of value-investing pioneer Benjamin
Graham, commented recently on how expensive the overall stock market is currently.
One of the metrics Buffett uses to describe the valuation of stocks is to compare
the market value of stocks to the size of the U.S. economy. The metric used
to measure the size of the economy is the Gross Domestic Product (GDP). Sometimes
Mr. Market bids up stock prices to lofty levels relative to GDP, and at other
times stocks become depressed relative to the size of the overall economy.
This valuation ratio is not a short-term market-timing tool, but it does provide
guidance as to whether returns will be above or below the average over the
longer term.
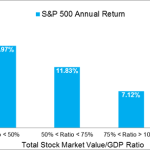
The chart below illustrates the performance of the S&P 500 at different
valuation levels. As the overall stock market becomes more expensive relative
to the size of the U.S. economy (GDP), average annual returns over the next
5 years trend lower. The current reading on the stock-market-value-to-GDP ratio
is currently more than 100%. Historically, this has not been the greatest entry
point for someone putting new money to work in a broadly diversified stock
fund, even one that charges low fees.
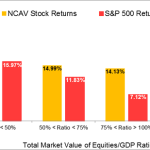
Unlike the S&P 500 Index, the disappointing stock performance at lofty
valuation levels does not seem to be the case if one follows Benjamin Graham’s
rule for enterprising investors by only purchasing stocks trading below net
current asset value.
Net current asset value (NCAV) is a simple calculation used to describe the
minimum liquidation value of a firm. The calculation is made by subtracting
all liabilities — including preferred stock — from the most liquid assets
on a company’s balance sheet and converting the figure to a per-share basis.
If a company is found trading below net current asset value, the performance
of these out-of-favor stocks is excellent. The chart below assumes an investor
puts no more than 10% in any one stock trading below 75% of net current asset
value and holds the stock for a 5-year period. Using Buffett’s favorite indicator
for overall stock valuation, even when stocks are lofty in price relative to
GDP, the performance of net current asset value stocks holds up.
Why is it that stocks trading below net current asset value outperform even
during time periods when the overall market is expensive? One reason is the
superior selection criterion of investing in stocks trading below liquidation
value. The other reason is having the discipline to let some funds sit idle
during time periods when the stock market is expensive. There are fewer stocks
trading below net current asset value when the market is at an extreme high
relative to GDP. By restricting purchases to no more than 10% in any one stock,
our net current asset value portfolio sat partially in Treasury Bills more
than half the time when the stock- market-to-GDP ratio was more than 100%.
Many investors feel a psychological comfort in joining the collective conscious
and purchasing stocks when everyone else seems to be buying. Those time periods
seem to coincide with lofty stock valuations. During time periods when stocks
are expensive, investors embracing a value investment philosophy are tempted
to relax their buying criterion and load up on stocks. Having a portion of
your funds sitting on the sidelines, waiting for more stocks to trade below
liquidation value is hard to do when stocks continue to bubble higher. The
illustration above shows that investors who can discipline themselves to remain
partially in low-interest-bearing Treasury Bills when stocks are expensive
can still do well over the long term in terms of portfolio performance.
Enterprising investors should avoid the temptation to purchase stocks trading
at a higher valuation than net current asset value, regardless of where the
overall market is trading relative to GDP. When stocks are expensive relative
to GDP, spending time pursuing other activities might be more productive than
abandoning the strict value-investing criterion and wandering into the area
of pure stock speculation.
Please enable JavaScript to view the comments powered by Disqus.
Author: Victor Wendl
Victor J. Wendl
President
wendlfinancial.com
Important Disclosure: Victor Wendl is the author of The Net Current
Asset Value Approach to Stock Investing. The book reviews the performance
over a 60 year time period of purchasing stocks trading below net current
asset value. The stock filtering criterion was popularized by Benjamin Graham,
the father of value investing, and a mentor to Warren Buffett who considered
his professor and former employer one of the most influential people in his
life. The Net Current Asset Value Approach to Stock Investing is available
for purchase on Amazon.com,
as well as for Nook and Kindle reading
devices.
Wendl Financial, Inc. is registered as an investment adviser with the state
of Missouri and only conducts business in states where it is properly registered,
or is excluded or exempted from registration requirements. Registration as
an investment adviser does not constitute an endorsement of the firm by securities
regulators. The information in this article is for general information purposes
only and should not be construed as personalized investment advice.
You must be aware of the risks and be willing to accept them in order to invest
in the stock market. Don’t trade with money you can’t afford to lose. This
is neither a solicitation nor an offer to buy stocks. No representation is
being made that any account will or is likely to achieve profits or losses
similar to those discussed on this Web site. The past performance of any trading
system or methodology is not necessarily indicative of future results. No representation
is being made that any account will or is likely to achieve profits or losses
similar to those shown.
Past performance results is not an indication of future performance. Wendl
Financial shall have no liability of whatever nature in respect of any claims,
damages, loss, or expense arising out of or in connection with the reliance
by you on the contents of our website.
Copyright © 2014 Victor Wendl
All Images, XHTML Renderings, and Source Code Copyright © Safehaven.com
Link:
How Do Net Current Asset Value Stocks Perform When Buffett's …
See which stocks are being affected by Social Media

