
How To Trade Credit Card Stocks (MA,AXP,DFS,V) – Investopedia
They may serve the same function, but not all credit cards are the same, as their commercials try to tell you. The same can be said for their stocks. Varying performance over the last several months shows that investors favor a couple companies over others. One credit card company remains in a strong uptrend, another in a weak uptrend, and two others are in downtrends. If you’re thinking of adding a credit card stock to your portfolio — for the short-term or long-term — here are some technical levels to keep in mind.
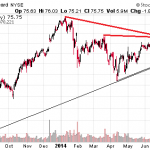
Visa Inc. (V) peaked in January at $235.50 and has been trending lower since. In April, its price started to bounce but was unable to reach its March high of $232.67. A drop below $210 breaks a long-term upward trendline going back to 2011, and also breaks the short-term upward trendline going back to April. While a trendline break isn’t always significant on its own, given that the price has already made multiple lower highs and lower lows (downtrend), the break does add credibility to the argument that the stock could be in for a further decline. $180 and $173 are likely targets based on Fibonacci extension levels and the current price structure for those looking to participate in the downside. For those looking to buy the stock, now may not the be time. Wait for a deeper correction; there is still an even longer-term uptrend in place, but the current weakness doesn’t warrant buying at this time. (For related reading, see: When Not To Trade.)
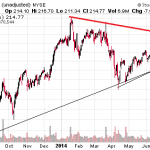
MasterCard Inc. (MA) is in the same boat as Visa; the two stocks are highly correlated, although they do see slightly differing percentage returns. MasterCard peaked in January at $84.75 and has been in a downtrend since. If the stock drops below $73 it will break a short-term trendline as well as a long-term trendline going back to 2012. The target for that move is between $65 and $62 for those looking to participate in the downside. Similar to the Visa story, for those looking to the buy stock now may not be the best time. Current weakness could continue to push the price lower, offering a much better entry price in the future.
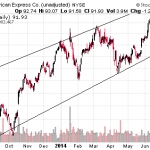
American Express Co. (AXP) is continuing to channel higher, putting in a fresh July high at $96.24. Channel support comes in between $90 and $87, offering a buying opportunity for those who believe the channel and uptrend will continue. Upside target for the trade is the top of the channel near $97, and potentially $100 on a strong surge. Longer-term traders can hold for longer if anticipating further strength; placing a stop below $84 will limit risk. One cautionary note is that within the larger channel a wedge has formed. Wedges are often reversal patterns (not , though). A drop below $87 clears the channel and the wedge, indicating a further decline. A drop below $83.99 (the April low) puts in a lower low, and while the price may bounce short-term, an overall downtrend is likely to emerge. (For more on this topic, see: Channeling: Charting A Path To Success.)
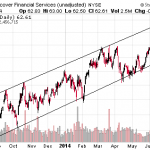
Year-to-date, Discovery Financial Services (DFS) has been outperforming the other three major credit cards in terms of stock performance, putting in a new high at $64.44 in mid-July. The stock is moving within a well defined upward trend channel going back to mid-2013. Between $59 and $58 is where the channel provides support, offering a buying opportunity for those who believe the channel will continue. The target for the long position is between $66 and $68 (top of channel, which will increase over time since the channel is sloped). The uptrend remains in tact as long as the price stays above $54.35 (April low). A fall much below that will have significantly broken the trend channel and created a lower low. While a bounce could occur after this, an overall downtrend will likely be underway.
The Bottom Line
While they’re in the same industry, these credit card stocks are behaving quite differently and should be traded accordingly. When short-term trading, buy in the direction of the trend on pullbacks and avoid buying stocks that are showing overall weakness. When looking for longer-term trades, wait for corrections but “don’t catch the falling knife.” Solo investors are nimble enough to wait for a pullback and then see conditions improve before jumping in. Use stop losses to control risk in the event a trade doesn’t work out and keep position size manageable so a single loss only results in a small draw down in account capital.
Disclaimer: Cory Mitchell does not own or have interests in any of the stocks mentioned in this article.
More:
How To Trade Credit Card Stocks (MA,AXP,DFS,V) – Investopedia
See which stocks are being affected by Social Media

