
How Traders Can Utilize CCI (Commodity Channel Index) To Trade …
The CCI, or Commodity Channel Index, was developed by Donald Lambert, a technical analyst who originally published the indicator in Commodities magazine (now Futures) in 1980. Despite its name, the CCI can be used in any market and is not just for commodities. The CCI was originally developed to spot long-term trend changes but has been adapted by traders for use on all time frames. Here are two strategies that both investors and traders can employ.
CCI Indicator
The CCI compares the current price to an average price over a period of time. The indicator fluctuates above or below zero, moving into positive or negative territory. While most values, approximately 75%, will fall between -100 and +100, about 25% of the values will fall outside this range, indicating a lot of weakness or strength in the price movement.
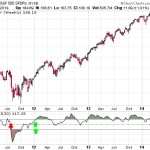
Figure 1. Stock Chart with CCI Indicator
The chart above uses 30 periods in the CCI calculation; since the chart is a monthly chart, each new calculation is based on the most recent 30 months. CCIs of 20 and 40 periods are also common.
A period refers to the number of price bars the indicator will include in its calculation. The price bars can be one-minute, five-minute, daily, weekly, monthly or any time frame you have accessible on your charts.
The longer the period chosen (the more bars in the calculation), the less often the indicator will move outside -100 or +100. Short-term traders prefer a shorter period (fewer price bars in the calculation) since it will provide more signals, while longer-term trades and investors prefer a longer period such as 30 or 40. Using a daily or weekly chart is recommended for longer-term traders, while short-term trades can apply the indicator to an hourly chart or even a one-minute chart.
Indicator calculations are performed automatically by charting software or a trading platform; you’re only required to input the number of periods you wish to use and choose a time frame for your chart (such as 4-hour, daily, weekly, etc). Stockcharts.com, Freestockcharts.com and trading platforms such as Thinkorswim and MetaTrader all provide the CCI indicator. Select the indicator from the indicators list to add it to your chart.
When the CCI is above +100, the price is well above the average price as measured by the indicator. When the indicator is below -100, the price is well below the average price.
CCI Basic Strategy
A basic CCI strategy is to watch for the CCI to move above +100 to generate buy signals and move below -100 to generate sell or short trade signals. Investors may only wish to take the buy signals, exit when the sell signals occurs and then re-invest when the buy signal occurs again.
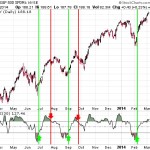
Figure 2. ETF Chart with CCI Basic Trade Signals
The weekly chart above generated a sell signal in 2011 when the CCI dipped below -100. This would have told longer-term traders that a potential downtrend was underway. More active traders could have also used this as a short-sale signal. In early 2012 a buy signal was triggered, and the long position stays open until the CCI moves below -100.
Multiple-Time-Frame CCI Strategy
The CCI can also be used on multiple time frames. A long-term chart is used to establish the dominant trend, while a shorter-term chart is used to establish pullbacks and entry points into that trend. This strategy favors more active traders and can even be used for day trading, as the “long term” and “short term” is relative to how long a trader wants their positions to last.
Similar to the basic strategy, when the CCI moves above +100 on your longer-term chart, the trend is up and you only watch for buy signals on the shorter-term chart. The trend is considered up until the longer-term CCI dips below -100.
Figure 2 shows a weekly uptrend since early 2012. If this is your longer-term chart, you will only take buy signals on the shorter-term chart.
When using a daily chart as the shorter time frame, buy when the CCI dips below -100 and then rallies back above -100. Exit the trade once the CCI moves above +100 and then drops back below +100. Alternatively, if the trend on the longer-term CCI turns down, exit all long positions.
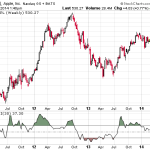
Figure 3. Buy Signals and Exits in Longer-term Uptrend
Figure 3 shows three buy signals on the daily chart and two sell signals. No short trades are initiated, since the CCI on the long-term chart shows an uptrend.
When the CCI is below -100 on the longer-term chart, only take short sale signals on the shorter-term chart. The downtrend is in effect until the longer-term CCI rallies above +100.
Take a short trade when the CCI rallies above +100 and then drops back below +100 on the shorter-term chart. Exit the short trade once the CCI moves below -100 and then rallies back above -100. Alternatively, if the trend on the longer-term CCI turns up, exit all short positions.
Alterations and Pitfalls
You can adjust the strategy rules to make the strategy more stringent or lenient. For example, when using multiple time frames, make the strategy more stringent by only taking long positions on the shorter time frame when the longer-term CCI is above +100. This will reduce the number of signals, but will ensure the overall trend is very strong.
Entry and exit rules on the shorter time frame can also be adjusted. For example, if the longer-term trend is up, you may allow the CCI on the shorter-term chart to dip below -100 and then rally back above zero (instead of -100) before buying. This will likely result in a paying a higher price, but offers more assurance that the short-term pullback is over and the longer-term trend is resuming. With the exit, you may wish to allow the price to rally above +100 and then dip below zero (instead of +100) before closing the long position. While this could mean holding through some small pullbacks, it may increase profits during a very strong trend.
The examples above use a weekly long-term and daily short-term chart. Other combinations can be used to suit your needs, such as a daily and hourly chart, or a 15-minute and one-minute chart, etc. If you’re getting too many or too few trade signals, adjust the period of the CCI to see if this corrects this issue.
Unfortunately, the strategy is likely to produce multiple false signals or losing trades when conditions turn choppy. It is quite possible that the CCI may cross back and forth across a signal level, resulting in losses or unclear short-term direction. In such cases, trust the first signal as long as the longer-term chart confirms your entry direction.
The strategy does not include a stop loss, although trading with a stop loss is recommended so risk is capped to a certain amount. When buying, a stop loss can be placed below the recent swing low; when shorting, a stop loss can be placed above the recent swing high.
The Bottom Line
The CCI can be used on any market or time frame. One time frame can be used, but trading with two will provide more signals for active traders. Use the CCI on the longer-term chart to establish the dominant trend, and on the shorter-term chart to isolate pullbacks and generate trade signals. The strategies and indicators are not without pitfalls; adjusting strategy criteria and the indicator period may provide better performance, although all systems are susceptible to losing trades. Implement a stop loss strategy to cap risk, and test the CCI strategy for profitability on your market and time frame before using.
More here:
How Traders Can Utilize CCI (Commodity Channel Index) To Trade …

