
Interest Rate Scenarios & Stock Market PerformancePragmatic …
By Ben Carlson, A Wealth of Common Sense
“In the case of equities or real estate or farms or whatever, other very important variables are almost always at work, and that means the effect of interest rate changes is usually obscured. Nonetheless, the effect–like the invisible pull of gravity–is constantly there.” – Warren Buffett
The way I see it there are currently two big worries about interest rates and how they could potentially affect the stock market:
(1) Interest rates will rise and stocks eventually fall because elevated discount rates would present a higher hurdle rate for potential investments.
(2) Interest rates and inflation stay low for a prolonged period of time caused by a less-than-stellar economic backdrop that hurts corporate profits.
Both are valid issues to consider. What really matters is the reason for each move, but since that’s impossible to predict with any certainty, we can at least look to past situations to see how stocks performed under similar rate moves in the past.
Scenario 1: Rates Head Higher
Warren Buffett explained the importance of interest rates and their effect on stock prices in an article from back in the day on CNN Money:
…we need first to look at one of the two important variables that affect investment results: interest rates. These act on financial valuations the way gravity acts on matter: The higher the rate, the greater the downward pull. That’s because the rates of return that investors need from any kind of investment are directly tied to the risk-free rate that they can earn from government securities. So if the government rate rises, the prices of all other investments must adjust downward, to a level that brings their expected rates of return into line. Conversely, if government interest rates fall, the move pushes the prices of all other investments upward. The basic proposition is this: What an investor should pay today for a dollar to be received tomorrow can only be determined by first looking at the risk-free interest rate.
Consequently, every time the risk-free rate moves by one basis point–by 0.01%–the value of every investment in the country changes. People can see this easily in the case of bonds, whose value is normally affected only by interest rates.
Since all investments are technically the sum of their discounted future cash flows, as usual, Mr. Buffett’s line of thinking makes sense. While this textbook definition works, the financial markets are a function of many moving parts (valuation, trends, economic activity, sentiment, inflation, etc.) so it’ not always quite so easy to see theory play out under actual market conditions.
Since we’ve been through a 30+ year decline in interest rates, not many investors have experienced a sustained move higher in bond yields. You have to go all the way back to the mid-1950s to see how this scenario played out in the past.
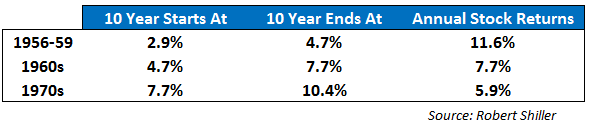
There was basically an uninterrupted rise in rates from the mid-50s until the early 1980s. Here are the 10 year treasury yield changes in that time along with the corresponding S&P 500 returns:
Stocks held up fairly well in the first move higher in the 10 year and although there were a handful of bear markets in the 60s, stocks performed reasonable well over that decade. It was the 1970s that really turned ugly. The nearly 6% annual return doesn’t sound too bad, but inflation was running in excess of 7% annually, so in real terms investors actually lost out to inflation in that decade.
So stocks were able to handle higher rates up to a certain point, but once inflation got out of control, performance really suffered.
Scenario 2: Rates Stay Low for a Long Time
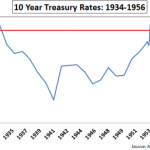
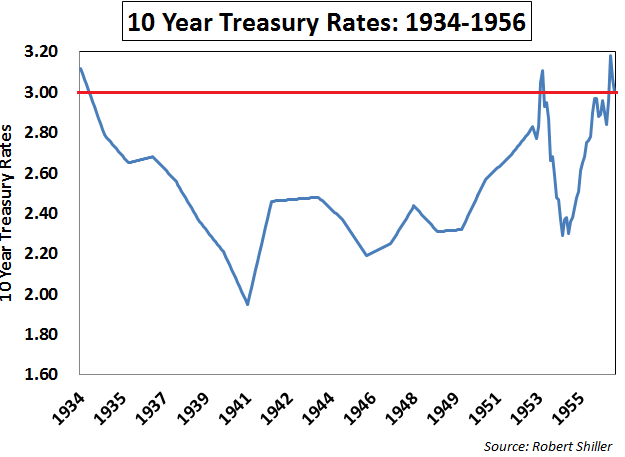
Low rates for an extended period of time and a the possibility of a secular stagnation is another worry these days. There is a precedent for this scenario as well. From 1934 to 1956, 10 year treasury rates were basically stuck under 3% as you can see here:
The economy went through four recessions in that time frame as well, with the average contraction lasting just shy of eleven months. There was a recession roughly once every five years.
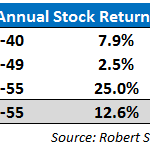
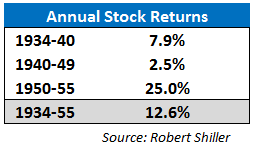
So how did stocks do during this period of 20+ year period of low rates and stops and starts in economic activity?
The 1940s was a tough decade for returns, but if you held on for the entire 20 years and change you actually fared pretty well:
As alway, stock returns don’t move in a straight and there are some stretches where you don’t earn much. But over the entire cycle stocks performed wonderfully, even if the performance was back-loaded.
Obviously, even though rates are currently close to these past levels, you have to take all historical scenario analysis with a grain of salt. Conditions under each new cycle are always different. Using historical market information can help you understand the potential risks involved but it can’t tell you exactly how to position your portfolio going forward.
Unfortunately, markets don’t exist in a vacuum. The outcomes are based on expectations as opposed to absolute outcomes. It really depends how much of a move one way or another the markets have already priced in.
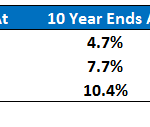
Because I like to take the long view, I also decided to run the numbers over the entirety of both interest rate scenarios just to see how stocks did from 1934 to 1980 before the huge bull market took off.
Over 47 years the S&P 500 was up 10.4% annually over a stagnating interest rate environment followed by one of rapidly rising rates. Not bad.
Sources:
Mr. Buffett on the Stock Market (CNN Money)
Read this article:
Interest Rate Scenarios & Stock Market PerformancePragmatic …

