
Is There Too Much Complacency In The Stock Market? | Seeking …
Summary
Many bears, short sellers and potentially objective news reporters keep saying there is too much complacency.
Others say this is the most hated bull market in history, so we should be bullish.
This article reviews matters and concludes that stocks are indeed risky, but great companies are still selling for reasonable prices; I want to continue to own them.
Background: When market prices are high and rising, it’s natural to fear that they will descend while one has remained fully invested. This makes for a lot of anxious market participants who are waiting for the other shoe to drop. This in turn supports the idea that this is the most hated bull market in history, thus you should be a brave person and should stay the course. Then there’s the opposite argument, which is that your fellow investors are in la-la land, oblivious to the riskiness of the situation, thus you should either lighten up on stocks, not jump in now if you’re not in stocks, hedge with options or bear funds, etc. Some Fed heads have started worrying publicly about this possibility.
There is so much chatter about this extended bull market that I wish to examine it further in some detail.
Introduction: Where are we, really, in the markets for cash, bonds, and stocks? Are the powers that be pumping and over-promoting stocks as an asset class, leading the mass of investors to overprice them and thus be set up for large falls in price?
The combination of “not too hot and not too cold” numbers that is allowing stock and bond prices to be in long term secular bull markets is the Goldilocks scenario. Are the bears coming home to chase her away and ruin her enjoyment of the nice house, food and beds?
Here is one of the common arguments from those who are either short the market or simply believe that stocks are overpriced.
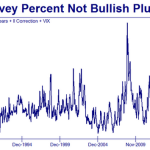
From a skeptic who “argues” the bear case nicely, sometimes with some persuasiveness, and who (naturally) gets picked up by Zero Hedge, is Not_Jim_Cramer. Per ZH, he came out with the following chart tweet very recently:
The commentary (in bold font as shown below) was:
“We have nothing to fear but the lack of fear itself”
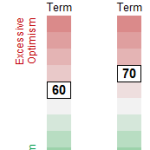
Is that statement valid? If we look a different, more sophisticated measure of bullishness, the CNNMoney Fear and Greed index, we see lots of “extreme greed.”
Seven Fear & Greed Indicators
Market Momentum
Extreme Greed
Last changed May 23 from a Greed rating
Updated Jun 6 at 4:03pm
Junk Bond Demand
Extreme Greed
Safe Haven Demand
Extreme Greed
Stock Price Strength
Extreme Greed
Put and Call Options
Extreme Greed
Stock Price Breadth
Greed
Market Volatility
Neutral
Yet if one goes to that site and correlates other episodes with subsequent market action, there is no correlation over the past couple of years with extreme greed readings with anything bad. In contrast, extreme fear readings were buy opportunities.
The conclusion so far is the old, well-known one: in bull markets, positive momentum causes short sellers to cover, and cash on the sidelines chases prices that are higher than before. Thus the same equity (or the same market) changes hands at higher and higher prices. Extreme momentum readings tend to correlate with higher prices down the road, often promptly, and are not negative indicators.
The first chart shown above, which is from a bear and is supposed to scare us, leads to the opposite conclusion, if indeed any conclusion can be drawn at all. The “complacent” numbers seen now were also seen around the time of the mild 1990-91 recession and in late 2004 and thereafter for a while. If one went long in 1990 or 1991 during another minimum, one got to own stocks for an amazing run. If one went long in December 2004 or early 2005, the other minimum, one had lots of time to make good money owning shares, and from then to now, one did fine if one did not sell near the bottom in 2008 and thereafter when prices were down.
Are investors really bullish, so we should be contrarians and therefore bearish?:
A recent study suggests yes, but again, it’s misinterpreting the numbers. Per a Howard Gold column at MarketWatch, investors are underweighted in stocks. Supposedly this has been at an extreme level of avoidance of equities, given this headline for the article:
Not even a bull market can interest people in stocks: Equity ownership falls to the lowest level in over half a century
Does this square with the story that there is too much complacency, too much speculation? Don’t we know that people have gone gaga for garbage?
The answer is that the financial community, including governments, has been issuing more bonds than equities over the past years. Since someone or some entity has to hold these debt instruments, Mr. Gold’s statistic is of little or no value. The garbage that some have flocked to has often been in the bond family, not stocks.
There are other examples where the alleged complacency is simply overstated. In blog after blog, or article after article on stocks, for years now all sorts of extreme sentiment data have been presented. Often these are lifted from SentimenTrader. While this is a subscription-only e-zine, for free on its home page it provides an update on its summary findings of investor sentiment. For some time it has been neutral. Here is a cut and paste of the reading as of June 5:
Current Investor Sentiment
Hardly frothy; nothing like what was seen in the late ’90s. So what the bears do is pick out the extreme sentiment examples and knowingly not show the totality of sentiment. Be not fooled!
Ultimately, fundamentals rule. By such fundamentals as various versions of Tobin’s q ratio, Shiller’s cyclically-averaged P/E, etc., stocks are truly richly priced. However, even the (current) bear John Hussman projects that stocks are priced to yield slightly over 2% annually for the next decade, before reverting to yield historical norms around 9% annually. So if one prospectively looks out 20 years and accepts his calculations, one can infer a tendency for stocks to return 5-6% on average, though with a good chance that returns in the next several years will be below average, at least at some point. If correct, this does not argue strongly to flee stocks, because where does one flee to? Cash?
The yield curve knows all of Hussman’s arguments and puts them in their place. It is a conundrum, indeed.
Macro observations, post-Great Recession: We learned from This Time It’s Different: Eight Centuries of Financial Folly, published in 2009, by Ken Rogoff and Carmen Rinehart, that typical financial crises are met with money-printing and official support for the offending institutions that helped cause the crisis. Also typically, it has taken about 5-6 years from the beginning of the crisis for the economy to resolve, and the financial markets have led the economy.
What has happened is not all that complicated, at least as it appears today. The mild deflation of 2008-9 has met massive monetary inflation in the service of monetizing fiscal deficits and mortgage debt. The over-capacity of labor plus some excessive productive capacity has allowed all those extra dollars the Fed has printed to create only modest price inflation. At the same time, such factors as Federal deficit spending plus surging oil and gas production have provided strong tailwinds to the pace of economic activity. So, Goldilocks has stayed happy, and stocks have swung from down over 50% from their highs of 2007 to up from those same all-time highs.
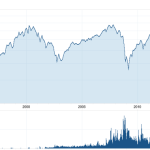
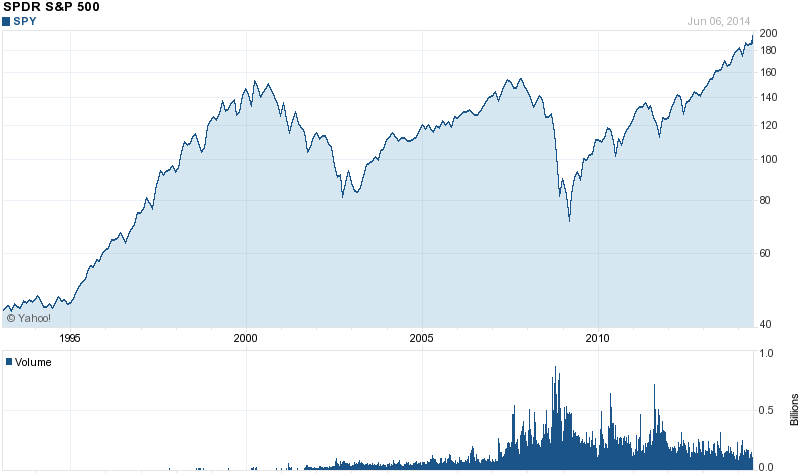
While we have come a long way, it’s worth thinking both of Y2K and 2007, when the S&P 500 set records above 1500, as shown by how far its major ETF, the SPDR S&P 500 (SPY), surged from inception into 2000:
From the frantic peak in 2000, stock market returns have lagged those available from 30 year Treasuries. (So much for efficient markets.) Even from the peak in 2007, about seven years ago, total returns may only be around 6% annually with dividends included. That number is below what would have been available from a corporate bond at the time and essentially identical on an after-tax basis to returns available from municipal bonds.
Does the fact that from prior peaks, markets have had acceptable returns years later, have any relevance to what the future holds? After all, both in 2000 and 2007, the Fed had tightened and the yield curve had flattened. Rates of 6% in 2000 and 5% in 2007 were available all along the Treasury curve. Unlike today, in each of those cases, there was reason for investors to reprice stocks down in favor of bonds, or alternatively to move to cash.
Today, cash has been trash for years on end, and perhaps we can all agree that bonds are best suited for traders, cautious savers, or potentially on the very long end for optimists on inflation. Stocks have the potential to keep up with anticipated or worse than expected inflation, and the different types of equities allow investors to opt for growth, income, natural resources, real estate, etc. So even though stocks are undoubtedly richly-valued on many metrics, what major asset is sufficiently underpriced to induce investors to engage in a major repricing of stocks downward versus that other asset?
In the absence of a large move downward in earnings that is viewed as potentially a sustainable down move, it’s hard to see any.
I believe that there is rational exuberance today in stock prices when viewed in the context of prevailing interest rates. If you want cheap, you can invest in China or Russia. That’s the way it used to be. Chancy foreign bourses should be cheap. If you want the many and often singular advantages of investing in the U.S., whether it’s a stock or bond, you pay up. It all makes sense.
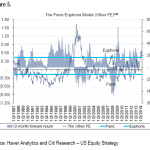
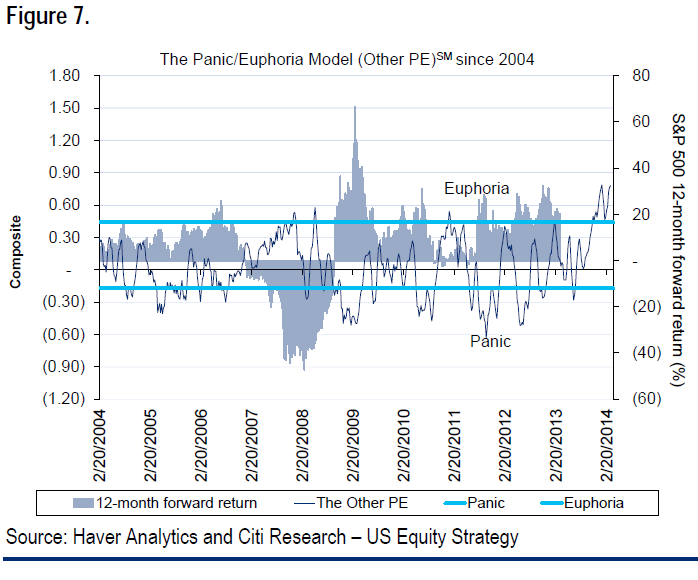
A contrary bit of evidence: There is one indicator that I respect that objectively argues for real caution here. This is the Citi Panic-Euphoria Model. It was developed in the early ’00s using extensive back-testing. I was a Citi-Smith Barney client at the time, and remember its introduction. Its point was to look past meaningless surveys of what investors said they were thinking or said they had doing or were going to do, and measure what they had done and were doing. The index is contrarian. Since its introduction, it has actually done a good job of identifying peaks, though it was a bit early in the 1999 period. This index is proprietary and not freely available, but I found two versions of it from this year. Here they are:
Citi revisits its Panic/Euphoria Index just when no one wants to hear it
Breaking down the Other PE model
The model uses premiums paid for puts and calls, short interest, retail money market funds, margin debt, the average bullishness of the American Association of Individual Investors (AAII) and Investors Intelligence, gas prices, trade volumes, commodity prices, and put call ratios to arrive at an estimate for sentiment. The factors are equal-weight, but they are also averaged and detrended in ways that make the model proprietary.
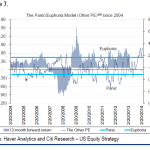
The model was also recently adjusted to exclude the effects of the dot com bubble, and Levkovich says that the updated version would have provided more useful euphoria signals ahead of previous market tops, showing the general robustness of the model.
More recently, in May, an updated version showed the index dipping below the high risk zone, but I would expect that the frantic up-move this past couple of weeks has sent it toward its recent highs.
Understanding the back-testing, this has been a decent contrarian measure allowing tops to actually be called.
Fundamentals: Due to the length of this article and its focus on sentiment, the only fundamental I want to mention is that the GDP analysis of Q1 2014 indicates a fundamental decline in operating earnings at a decent rate, perhaps 9% annualized. This was seen around 1998, as well. So it need not mean either recession or bad markets, but along with the age of this business expansion and increased amount of leveraged and subprime loans, it is consistent with the belief that this is a late-cycle bull market.
Conclusions: There are many bogus contrarian indicators out there that I am ignoring. However, stocks have chased bonds to join them in very high valuations, which implies elevated risk. The elevated readings in Citi’s Other P/E model is amongst the first I have seen this cycle to signal contrarian-based selling that actually has had some success previously in real time in predicting market declines.
The deceleration of corporate profits over the past year or two and the decline in at least one measure of them in the weather-challenged Q1 is consistent with the idea that the risk-reward for stocks has worsened and is not great on an intermediate-term basis.
However, there are a number of powerful companies with strong free cash flow that I view as mainstays of the economy of today and likely of tomorrow, and tomorrow, and tomorrow. The stocks sport FCF yields of 5-8% and P/E’s below 20X TTM earnings. I have frequently written of these stocks, including CVS Caremark (CVS), Johnson & Johnson (JNJ), and Gilead Sciences (GILD) in healthcare, and Oracle (ORCL) and Taiwan Semiconductor (TSM). (Note that TSM is not a FCF champion. I am also long Qualcomm (QCOM), another FCF star, though I haven’t written about it.
While those stocks sell well above book value, and often have little or no tangible book value, I am comfortable with the security of their earnings stream. I look at them as potentially able to rise in price even in a 2001 situation, meaning a mild recession and a decline in the average price of a share of stock. We may be in a similar situation as we were in Y2K, when the average stock plunged, but the undervalued Old Economy stocks actually bottomed in March 2000 when the NASDAQ peaked, and revaluation of the bubble stocks down occurred as many neglected stocks began their revaluations upward.
Summary: The current financial and market environment is unusually challenging, with cash, bonds and stocks all having various unattractive aspects. Many bits of data that are presented to shake investors out of their long positions are worthless. Others, such as the Citi Other PE model, have shown some value in the past. My own research suggests that stock selection is now of even greater importance than in the past. My choice is to own dominant companies that are reasonably valued, but not to chase more speculative stuff or fallen angels hoping for a rebound. However, I do believe that risk is rising, and that unexpected economic weakness going forward may well finally be followed by material and actionable repricing of the stock market as a whole downward, regardless of what interest rates do.
Source:
Is There Too Much Complacency In The Stock Market?Disclosure: I am long CVS, GILD, ORCL, TSM, JNJ, QCOM. I wrote this article myself, and it expresses my own opinions. I am not receiving compensation for it (other than from Seeking Alpha). I have no business relationship with any company whose stock is mentioned in this article. Not investment advice. I am not an investment adviser. (More…)
Read the article:
Is There Too Much Complacency In The Stock Market? | Seeking …
See which stocks are being affected by Social Media

