

Is Your Portfolio Positioned For The 2014 Stock Market Pull-Back …
Many prominent investing managers and firms are warning of a likely 10% stock market pull-back in 2014, so I figured it might make sense to assess what might cause the market to break-down, and additionally whether there are any good alternatives to re-position a portfolio given the high growth in stock values in the last year.
First, there is the question of the likelihood of a market pullback. The best way I have found to analyze the possibility of a stock market pullback is to answer the question “are there strong enough market forces to motivate a large number of share owners to sell?” Motivation usually involves either more attractive risk-reward investment alternatives becoming available or the surfacing of a market jolting event.
This article will survey the market for evidence of these factors being in place to create a market stumble in 2014, and then present possible portfolio strategies given the present financial conditions.
What does Financial History Say about Election Year Stock Performance?
You might be expecting my rationale for a potential 2014 pull-back in stocks to start with continued poor corporate revenue growth and low aggregate demand relative to the acceleration in share prices in 2013. Such an analysis, although relevant, would be far too rational an approach for the current political economy in my opinion. Fundamentals have rarely mattered since the 2008 crisis, and I do not expect a change in the Federal Reserve driven 2014 economy. The current stock market is pricing in slow but steady growth and a Federal Reserve that continues to remain a backstop for any downturn. Who can lose in this environment?
But factors exist that potentially are not priced into the market. And one that I find very intriguing is the potential change on the horizon that could be triggered by the upcoming mid-term election.
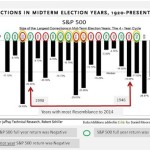
Mid-term election years tend to be turbulent for the stock market, possibly due to uncertainty surrounding government policy post election. Thanks to the primary data in the above chart compiled by Robert Schiller of Piper Jaffrey, you can see the historic volatility in mid-term election years, with peak to trough declines in the market in the 21 years analyzed showing a median pull-back of over 17%. What the data did not show was the market momentum in the year prior to the mid-term elections, and the results for the full mid-term election year. This data has been overlaid in color for the 18 mid-term elections since WWII.
The years in the graph which are circled in red or yellow are time periods associated with market corrections that entailed full year-over-year market declines, and generally were also associated with a recession. The year 2002 is a good example of a year in which the stock market was declining entering the year, and continued declining through the entire year. Whereas in 1982 the market entered the year in decline, and the economy was in recession, but the market improved through the year and ended higher.
In the years showing only a green circle, such as 1998, the stock market from January through December ended in positive territory, and the economy did not exhibit a recession.
What is interesting about the aggregate data is that if the stock market began the year going into the mid-term elections after a positive year and then entered a pull-back, 50% of the time it ended the year down (6 out of the 12 occurrences since WWII).
To add some additional information to the analysis, I have identified the two mid-term election years that in my review most resemble 2014. The first is 1946, a year that I have written about in a previous Seeking Alpha article as a model for present financial market circumstances. The reason the time frames are so much alike is that in 1946 the nation was undergoing a post war transition, the Federal Reserve was pegging interest rates to the zero boundary and the federal government was implementing major budget cuts and tax increases (actually far more severe than the present day cuts). The primary differences between the two periods are that in 1946 the U.S. did not have an unemployment problem and was running a trade account surplus. The time period exhibited a sharp inflationary burst followed by deflation that was eventually remedied through tax cuts and increased government spending later in the decade. As shown in the above graph, the stock market in 1946 declined 19.69% peak to trough.
The 1998 time period is a second time period that holds a high resemblance to the current time frame. The roaring late 90s with high internet company valuations and an accelerating stock market is a period that many readers should readily recall. It was also a period in which Alan Greenspan, although not in the same dollar magnitude and certainly not using Keynesian economic style monetary policy, was slowing down the rate of increase in Treasury purchases. The year was marked by crisis in the emerging markets, capped off by the Russian debt default. The crisis peaked in the summer, and moves to add liquidity to the market by the Fed eventually allowed the market to recover and end positive for the year. There is no way of knowing whether the International market will exhibit geopolitical unrest that affects stocks in the coming year; however, I do expect that the extreme Federal Reserve monetary policy is very likely to be tested in some fashion as Janet Yellen takes the position of Chairwoman.
Given the events that drove the results in the two most similar historical years, the actual outcome in 2014 may be more driven by political events than investors may be pricing into the market at the present time. Does the current fiscal and monetary policy combination that is revving up the stock market change if the Senate and House become controlled by Republicans? This uncertainty is likely to ride on the market beginning at some point this year.
If you are trying to formulate a strategy for this investing environment, you need to answer the following question – If I rebalance my portfolio by selling stocks, where would I reinvest and why?
Surveying the Market for Better investment Alternatives
Investing is a relative game, and right now the stock market is riding a wave of positive momentum that propelled the S&P 500 (SPY) up 29.7% in 2013 and the DOW (DIA) up 21.8%. These are stellar performances, and many investors are probably happy to see the results on their current brokerage statements. With the large increase in value, you might expect the stock market to look relatively more expensive than alternative assets that can provide an avenue for fund rotation to protect the large paper gains. What does the market actually reflect?
Assessing Fixed Income Portfolio Rebalancing Options
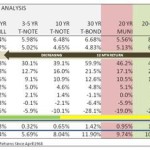
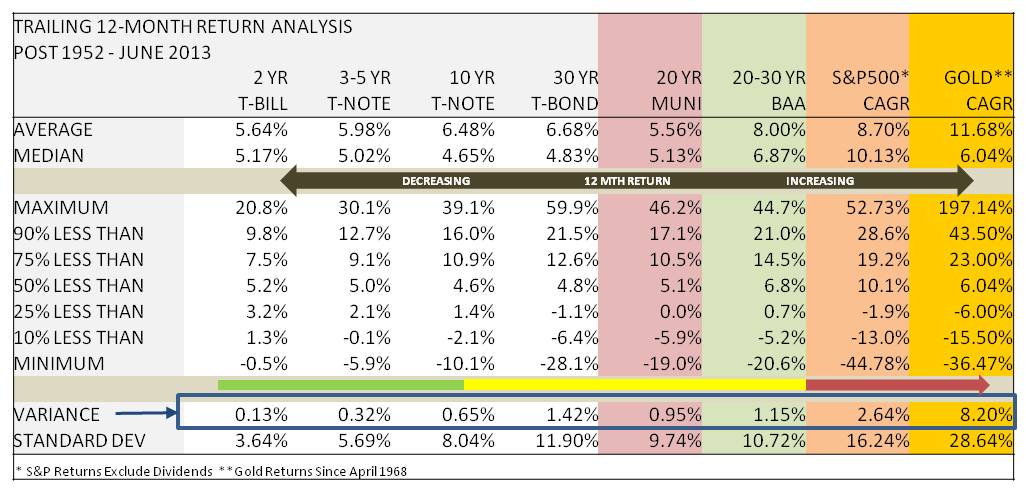
A useful starting point for evaluating potential assets available to rebalance equity market exposure is to look at the historical norms for relative returns in various asset classes. I use the table below which is compiled from historical market returns since 1952 for Treasuries, longer duration municipal and corporate bonds, the S&P 500 and gold (since 1968). The 1952 demarcation date is chosen because it reflects a point in history when the Federal Reserve moved away from its policy of pegging interest rates, making the data with the exception of the few years since 2008, a very good proxy of what investors should expect in an interest rate environment in which the market sets fair rates of return.
Treasuries Remain a High Priced Safety Play
The long end of the Treasury complex increased in yield from the spring of 2013 through the last trading day of the year. The 10-year Treasury note closed with a yield of 3.04% on 12/31/13 after hitting an interim month end low of 1.71% on 4/30/2013. Since the beginning of 2014, the yield on the 10 year decreased, closing at 2.84% on 1/13/2013. In fact, the entire Treasury yield curve compressed since the start of the New Year, accelerating downward in response to the jobs report on January 10th which showed lower than expected job growth. The flow of funds, at least for the start of 2014, showed a reversal of the trend away from longer duration Treasuries experienced in 2013. A report issued by Bank of America confirms that investors worldwide are indeed favoring fixed income over equities in the beginning of January.
The one aspect of the Treasury market (TLT) (SHY) trend is that the yields from a historical perspective remain meager. On a historical basis, a 5% rate of return across the maturity spectrum is the median over the last 60 years, and the average return is higher. The only way to achieve this high a rate of return on a 3% yielding 10 year T-Note is for rates to continue falling. This scenario may well be what many investors are anticipating through the coming year. The very short-end of the Treasury curve is currently pegged by the Fed, and the chances of realizing a 5% plus return on any Treasury with a maturity of 1-5 years, where current yields range from .11% to 1.6%, is very low.
Why are investors opting for a 3% 10 year or 4% 30 year Treasury investment when the historical average is considerably higher and the Fed has stated it is going to pare back bond buying? Maybe it is a short-term play to park funds until the market cools down; or, maybe it is signal about longer-term expectations about future market direction.
Municipal Bonds
If you have a taxable investment account, the municipal bond market is a potential sector to divert excess profits on stocks. Yields on municipal bonds currently are much closer to the historical norm than the corporate bond and Treasury market. The median 20+ year General Obligation municipal bond return was 5.13% over the past 60 years. On 1/9/2014, the Bond Buyer GO 20-YR Municipal Bond Index showed a yield of 4.68%, 45 basis point below the historical median. The reason municipal bonds are priced with a yield that is relatively more attractive than Treasury and Corporate bonds was discussed in an article I published at the end of the 3rd quarter 2013 – Municipal Bond Market Battles Bankruptcies and Rising Interest Rates. (MUB) (TFI) (PZA) (MLN) (SHM) (ITM)
The combination of bankruptcy trial fears in Detroit which might set new precedents for municipality default procedures, and the unknowns surrounding Puerto Rico’s ability to continue to obtain financing given its high debt load, weigh on the sector. There is also a hidden impact from the Volker rule that limits the ability of banks to speculate in their own account on municipal bonds as well as other financial assets. This change is causing demand in thinner traded markets for bonds to fall. At the present price levels, the long end of the municipal bond market is relatively attractive, but, not as attractive as September of 2013 when long duration yields peaked at over 5%.
The key to investing in the municipal bond sector is to diversify your holdings, as the market is wide and deep. Just like the stock market is made up of many different companies, the municipal bond market is made up of many different states, cities, utilities, universities, hospitals, and other public entities. A couple of bad credits like Detroit and Puerto Rico are bound to happen in a $3.7T market; however, historically the sector on an aggregate basis has very low default risk.
The best approach to manage potential systemic risk caused by the new precedents that may result from the Detroit proceedings is to buy insured bonds, be careful with investments in GO bonds in troubled states like Illinois and overweight revenue bonds with basic necessity services like water, power and sewer. I suspect the long end of the market is stable and may exhibit some capital appreciation in the event funds do start to leak out of stocks. There are many leveraged municipal bond CEFs that were beaten down in 2013 that may also provide attractive returns such as the Invesco Value Muni Income Fund (IIM) which has a tax-free yield of 6.55%, and invests only in insured bonds. You can search for other options, including state specific funds on the CEFConnect.com website.
Corporate Bonds and Preferred Stocks – Some Longer Duration Options Have Surfaced
The corporate bond market (BND) (LQD) (AGG) has also exhibited some interesting activity since the first of 2014. I look at the BAA1 market rate relative to Treasuries as a barometer of rising market risk. In the first week of the year, the BAA1 yield fell from 5.37% to 5.20%, narrowing the spread relative to the 30 year T-Bond. The increased demand for corporate bonds as funds flowed out of equities during the first trading days of 2014 is an indication that investors are presently not fearful about business conditions, and additionally are not as fearful about rising interest rates. Investors that exited corporate bond funds back in May and June simply may be returning to previously held positions.
Just as in the case of Treasuries, the one glaring aspect of the corporate bond market is that the present yield is well below the historical average of 8% and the median of 6.87%. However, there are pockets of opportunity within the overall market.
In order to obtain a 7% return in the corporate bond market, you have to extend some combination of duration and risk. Corporate borrowing post the 2008 financial crisis has been low relative to continued high demand for fixed income assets by investors. The media hype and perspective concerning the move to higher rates caused a brief period in which many investors became hesitant to use duration as a means of increasing returns. Since the May timeframe of 2013, avoiding the market was a good move. However, presently there are a greater number of individual longer term investment grade bonds and preferred stocks which approach, and in some cases exceed 7%. Given the current high price for the S&P 500, which historically averages a 10.7% return, not 30%, these types of investments have become better values for many investors than pure stock market plays. I point out REIT investments like the preferred stocks of Public Storage (PSA), (PSA.u), and the senior debt of Commonwealth REIT (CWH) (CWHO) as two examples. In addition, there are highly rated bank and insurance company preferred stocks such as BB&T Corp. (BBT) (BBT.f) and MetLife (MET) (MET.B) providing current yields much more in-line with the historical average for investment grade long duration investments.
Alternative Assets – Fixed Income Strategies with Higher Returns
The leverage bank loan and short duration CEF asset class was given a rude re-pricing during 2013, while un-leveraged funds and ETFs showed much lower price changes. Back in June of 2013 I provided an article warning that this was likely to happen, as the assets went through a similar scenario in 2004-05.
The big issue in 2013 for the asset class was the constraint placed on earnings caused by the zero-rate Fed policy. Term loans held by the funds are typically linked to LIBOR. As long as the Federal Reserve interest rate policy remains at the zero bound, the performance of these funds, in terms of interest rate protection and risk adjusted rate of return expected, will remain governed. Will this change in the coming year? In an economic growth scenario, the prospect for these funds is relatively good. However, there is one scenario in which these funds will not be a good choice – a deflation-led market downturn.
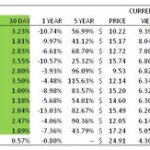
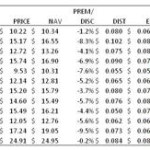
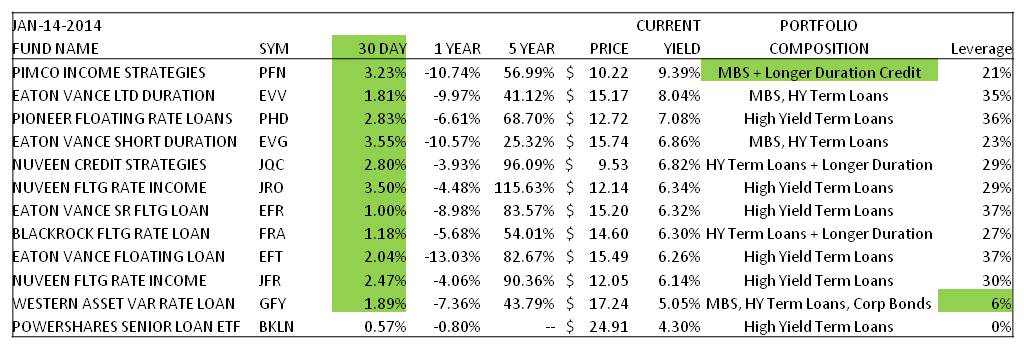
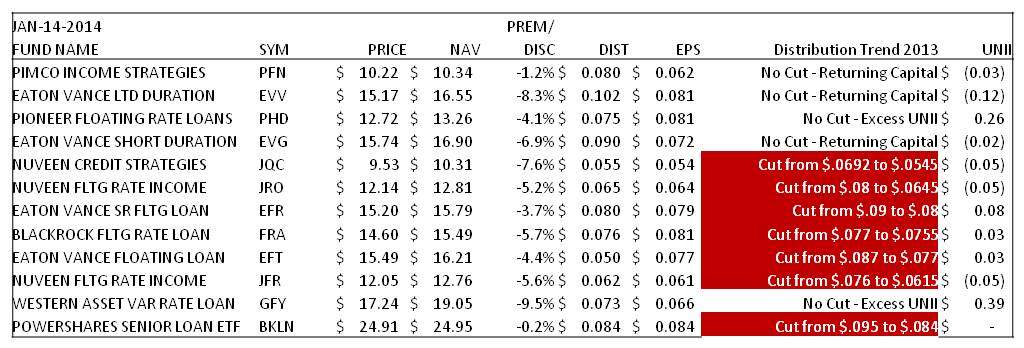
The following is a table of Floating Rate Term Loan and Short Duration Funds showing the performance of 12 funds in the sector on important metrics like current yield, earnings, the reduction in distributions over the past 12 months, and the UNII level (undistributed investment income). (PFN) (EVV) (PHD) (EVG) (JQC) (JRO) (EFR) (FRA) (EFT) (JFR) (GFY) (BKLN)
The unleveraged funds in the sector have current yields of 4.35% in the case of the Blackstone Leverage Loan ETF (BLKN), and 5.05% in the case of the almost unleveraged Western Variable Asset Fund. Both funds were good choices to protect principal back in June 2013. Given the distribution adjustments of most of the higher yield term loan funds, the leveraged funds are now better positioned to deliver stable 6% plus return performance over the intermediate term, and potentially show capital gains if the economy does expand and short-term interest rates rise. However, investors need to discount the possibility for actual rate increases until there is a clear change in economic growth and government policy.
Enhancing Return by Lengthening Duration
If you need evidence from prominent bond managers who are beginning to adjust tactics to produce higher risk adjusted returns to overcome Fed policy, I point to the PIMCO Income Strategy Fund II. Buried in the holdings of the fund is a growing level of longer duration corporate bonds and preferred stocks. Presently the fund has an investment maturity structure of shorter duration (1-9 year) versus longer duration (20-30 year) securities of 84%/16%. Over the last quarter, fund long term holdings were supplemented with bonds like the Verizon (VZ) 6.55% maturing in September 2043 (CUSIP: 92343VBT0). Other income-enhancing long bonds were also added to the portfolio.
Presently I do not advise adding long duration corporate bonds to a portfolio that pay less than a 6% coupon which is trading above par value. This personal constraint makes practically all of the unleveraged corporate bond funds questionable as attractive alternatives relative to stocks. However, if you can utilize a strategy similar to Bill Gross in the Pimco Fund, where you augment shorter duration MBS holdings with longer duration investment grade bonds, then you have, in my opinion, a potential option for unwinding overpriced stock positions. If you opt to invest in the fund, I suspect the 9% pay-out rate will eventually be cut. However, the fund is currently positioned to provide a 7% plus rate of return while still guarding against the wild card of rising rates. Compared to the high yield term loan funds, many of which have a high concentration of non-investment grade credits, PFN has over 50% of its holdings in investment grade securities as of 10/31/2013.
Pull-back Risk Low Due to Limited Alternatives – Caution Still Advised
As I survey the financial market two weeks into 2014, few investments exist that do not appear expensive. Treasuries, although yields have increased in the longer maturities, are still at historically low rates. The long-term corporate bond market, with the exception of a handful of opportunities that have surfaced over the latter half of 2013, is historically overpriced. The dearth of corporate borrowing for capital expenditures over the past several years is a very likely cause for the very low interest rates. The low borrowing rate is an indication economic growth is likely to continue to be slow. Municipal bonds are a relative buy, but do not serve as an attractive alternative for investors with IRA or 401K accounts, and many of the best buys were grabbed by investors back in September of 2013.
In other words, the options available for re-balancing continue to be limited or unattractive. Therefore, as long as the Fed continues to buy assets I look for stocks to continue to have positive momentum unless a major fear factor is introduced into the market like 1998.
Given this analysis, I feel the need to remind investors who just received a gift of a 30% rise in the S&P 500 in 2013 that “pigs always get slaughtered.” This market is expensive for a reason, and unfortunately it is not because there is likely to be a meteoric rise in GDP. It is because the Fed has rationed investable assets from the market by purchasing over $3T in assets on its own account since September 2008, skewing the natural cost of money which would result in a free market where banks are doing the lending, not the Fed buying assets. And, if the government policies which are creating the rationed market condition change, so too will the resulting market valuation.
I read recently in Time Magazine that Fed Chairwoman Janet Yellen has a philosophy that the Fed should be a benevolent institution with a responsibility to smooth out business cycles and reduce unemployment. I can’t argue with the objective, but I am confused by the current method. The present policy has skewed many financial sectors to higher than normal relative price levels. In the event that investors are spooked by geopolitical events or perhaps there is a change in economic policy that results from the upcoming election, I expect a fire drill in which owners of stocks take cover in Treasuries and the Fed has to make a decision whether it is going to sell from its balance sheet to satisfy the demand. Make sure you have sufficient cash generating assets and staying power if this future possibility turns into reality.
Daniel Moore is the author of the book Theory of Financial Relativity: Investment Portfolio Guidance in a Federal Reserve Driven Bubble Prone Deflationary Era. All opinions and analyses shared in this article are expressly his own, and intended for information purposes only and not advice to buy or sell.
Source:
Is Your Portfolio Positioned For The 2014 Stock Market Pull-Back Game?
Disclosure: I am long EVG, FRA, MET.B, IIM. I wrote this article myself, and it expresses my own opinions. I am not receiving compensation for it (other than from Seeking Alpha). I have no business relationship with any company whose stock is mentioned in this article. (More…)
Additional disclosure: Also long CWHO and PSA.u
Continue reading:
Is Your Portfolio Positioned For The 2014 Stock Market Pull-Back …
See which stocks are being affected by Social Media

