


It's deja vu all over again for the U.S. stock market PeterLBrandt …
It’s deja vu all over again for the U.S. stock market
Posted by PeterLBrandt
on May 7th, 2014
The current chart pattern in the Nasdaq is a near carbon copy to the S&P chart in mid 2011
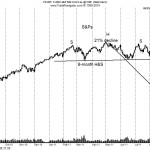
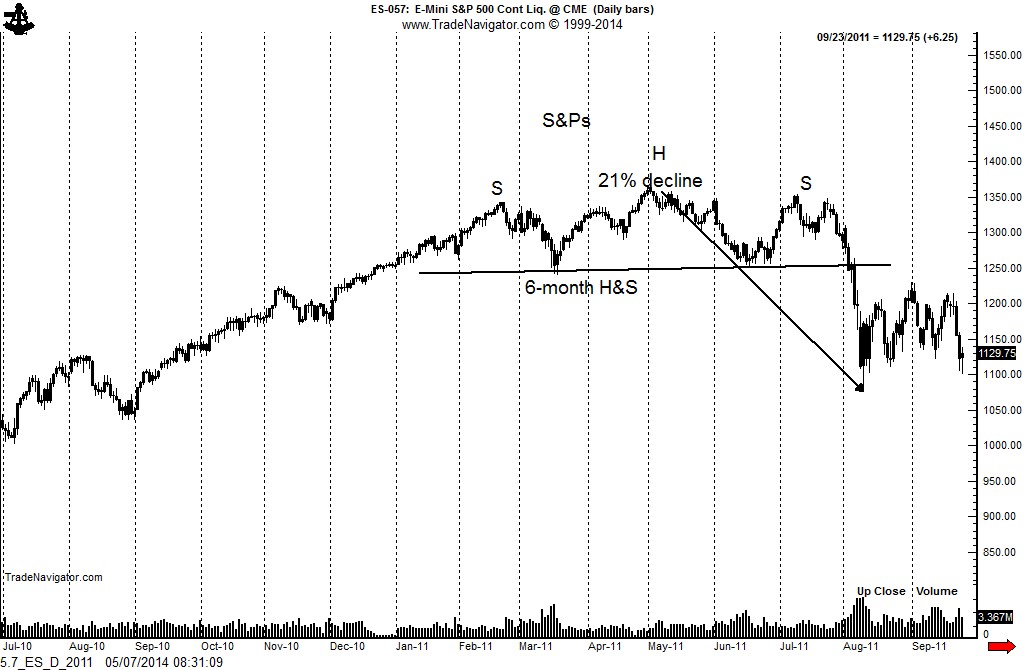
During the summer of 2011, the S&P chart traced out a near perfect H&S top pattern. The conventional wisdom at the time was that the H&S top would not work since it’s presence was conventional wisdom on the street. The talking’head “experts” on CNBC were basically saying, “Everyone sees the H&S top in the S&P so it has no chance to work.”
Of course, the H&S top in the S&Ps was completed on Aug 2, 2011. The target was reached four trading days later on Aug 8. The decline from the top of the head to the low of the move was 21%.
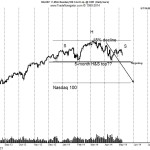
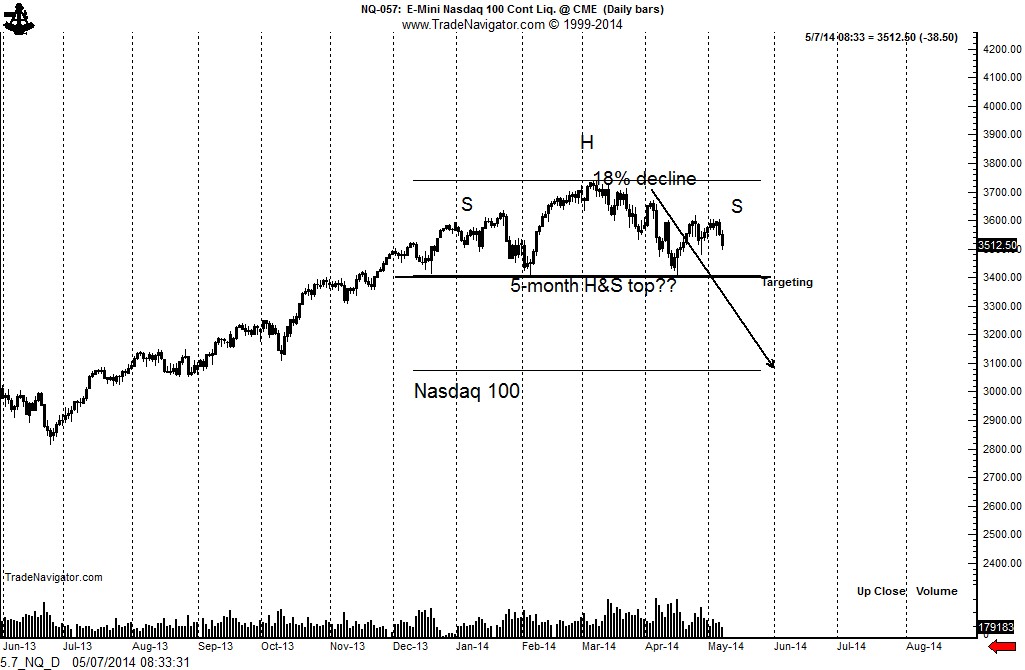
Fast forward to today. The H&S top in the Nasdaq has tons of naysayers (Webster defines a naysayer as “a person who says something will not work or is not possible“). The decline today could signal that the high of the right shoulder has been established. A decline from the top of the head to the indicated target of the H&S top would be 18%.
An advance and close above the existing right shoulder high at 3617 would go a very long way to negate the interpretation of this post.
The information in this blog post represents my own opinions and does not contain a recommendation for any particular security or investment. I or my affiliates may hold positions or other interests in securities mentioned in the Blog, please see my Disclaimer page for my full disclaimer.
View the discussion thread.blog comments powered by
Visit site:
It's deja vu all over again for the U.S. stock market PeterLBrandt …
See which stocks are being affected by Social Media

