
Jeff Saut: Don't Let This Quiet Week Fool You — Stock Market …
Someone once asked me to describe reversion to the mean in as simple terms as possible. My reply was if you know someone who’s normally ‘”mean” and then they are nice to you for a few days, chances are they’ll revert back to being mean. [Likewise, periods of high volatility tend to be followed by periods of lower volatility.] Conversely, periods of extremely low volatility tend to be followed by periods of higher volatility.
–David Landry,
Hard Right Edge
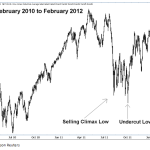
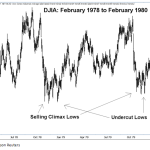
Last week the Volatility Index (INDEXCBOE:VIX) tagged 10.34 on an intraday basis for its lowest reading since late 2006 and early 2007. I wrote about that occurrence on Thursday morning, noting, “As I ran the numbers last night, there are roughly three weeks left until the volatility mix becomes more volatile. That said, I do believe the VIX bottomed last Friday (June 20) with an undercut low, much like the undercut low of October 4, 2011 that my firm identified as the “valuation low,” and recommended should be bought with the S&P 500 (INDEXSP:.INX) trading back then at 1075.” And with that statement, I received numerous requests to explain what an “undercut low” is. Recall that I began writing about the 1978 and 1979 bottoming sequence in August/September of 2011 because the chart patterns of those years were remarkably similar to what was happening in the summer of 2011. For example, study the nearby chart of the 1978 and 1979 declines. What you find is that the S&P 500 experienced a sharp decline into what I termed a “psychological,” or a “selling climax,” low. Then the SPX bounced up/down for a number of weeks in a trendless affair. However, right before the SPX was getting ready to begin a decent rally, it went down and broke below those “psychological lows” just enough to shake out all the closet technicians who thought we were about to get another new “leg” to the downside; and that was it — the SPX started to rally and never looked back. This same sequence occurred in the July – October bottoming sequence of 2011, and I think the same thing just happened with the VIX.
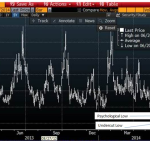
Indeed, look at the chart below of the VIX.
What you see is a decline into a “psychological low” followed by a rebound attempt, which failed, resulting in the “undercut low” of 10.34 just below the selling-climax low of a few weeks ago. If past is prelude, that 10.34 “print” should be the low water mark for the VIX with an ensuing pickup in volatility in the weeks/months ahead. Manifestly, “Periods of extremely low volatility tend to be followed by periods of higher volatility.” What this means for the equity markets is debatable and depends, in my opinion, on whether the SPX can stabilize above the 1940 – 1950 support level so often mentioned in these comments. So far the script has played pretty well with the SPX trading higher since its April 15, 2014 upside reversal at 1816 into the envisioned over-resistance zone between 1950 and 1975. From there, stocks have been on the defensive in a frustrating battle between the bulls and the bears that has left the SPX trapped between the mid-1960s and the mid-1940s. While many of the “bulls” claimed victory with last Friday’s late stock market comeback, I am not so sure because Friday’s massive rebalance of the Russell indices could have had a manipulative effect on the equity markets. Those rebalances affected more than $5 trillion in assets. Accordingly, I am waiting to see what happens this week on the Street of Dreams, although many of the players have already deserted Wall Street for an extended holiday.
The keen-sighted Jason Goepfert, captain of the excellent SentimenTrader.com service, notes the following:
So even though the VIX is “too low” compared to its historical range, it is still “too high” according to how volatile stocks have actually been. It appears as though traders are pricing in expectations of higher volatility, so even with a VIX as low as 11%, there is still evidence of too much fear in the market. Therefore, the VIX is more likely to decline in the coming months. That’s a nice theory, and it’s becoming more and more popular over the past week or so. But it’s wrong. Since 1986, there have been 612 days when the VIX was “underpriced” because it was lower than realized volatility. That should mean that the VIX will catch up, and rise over time. But six months later, the VIX was higher only 36% of the time and showed a median return of -9%. When the VIX was “overpriced” like it supposedly is now, then six months later it was higher 63% of the time and its average return was +14%. If the VIX was at 13% or below (as now), then six months later it was higher 54 out of 54 days (100% of the time), averaging +27%. Yes, the VIX is higher than it “should” be given the lack of movement in stocks. But that has NOT been a contrary sign in the past, and in fact precedes a rise in volatility more often than not.
Turning to the equity markets, I didn’t think there was anyone more bullish than me on the secular bull market thesis, which I think has years left to run. I was wrong! My friend, and strategist at BMO, namely Brian Belski, had this to say in his recent interview with the
London Financial Times
(the Pink Paper):
Based on historical evidence, stocks typically enter a very long period of expansion after emerging from a period of negative 10-year returns. We found that, on average, these periods last for roughly 15 years and deliver average annual returns of about 16%. Given that 10-year holding period returns emerged from negative territory a little over a year ago and currently stand at 5.5%, it is not unreasonable to assume that there is about 10 years and 10% of average annual returns left to the current bull market. To get to an S&P 500 level of more than 4200, we have assumed that 2 percentage points of the return is dividend, and just compounded the current 1962 level of the S&P forward for a decade.
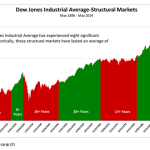
Wow, I thought, that sounds a lot like me, even though I am somewhat cautious currently on a trading basis. Still, I must admit there is an upward bias in this holiday-shortened week from a historic perspective as volume dries up and players leave for the holiday. However, my work indicates we are moving into a more volatile period in the weeks ahead, which is why I wrote, “As I ran the numbers last night, there are roughly three weeks left until the volatility mix becomes more volatile.” This implies more volatility should arrive in mid/late-July. Also of note is that there is a peak energy period slated for late-July and/or early-August. I wrote about such an energy mix during the summer of 2011. So, sticking with the 2011 “bottoming sequence” analogy, recall back then there was a similar energy mix in the works that manifested itself with an ~18% pullback. That decline for the SPX began the last week of July at 1344 and culminated in mid-August around 1100. From there, the SPX bobbed and weaved its way sideways until the “undercut low” of October 4, 2011, which as stated was the “valuation low.” Now, before I get a ton of emails asking, “What’s a valuation low?” remember this: There have been three-decade-plus-long range-bound markets since the 1929 crash (see chart below).
Every one of them experienced a nominal price low, the lowest the index would get in terms of price and then made a valuation low, the cheapest the index would get in terms of P/E, Price/Book Value, etc. In December 1974 the index made its nominal price low and in August of 1982 it made its valuation low. Likewise, in March 2009 the SPX made its nominal price low and, in my opinion, it made its valuation low on October 4, 2011. Also observe that every time the index broke out above its multi-year trading high, it has been in a new secular bull market. Now study the chart and harken back to Brian Belski’s sage words!
The call for this week: Today is the deadline for the Longshoremen’s Strike on the West Coast, which could impact our economy on a short-term basis. Today is also critical to see if there will be a “buyers’ strike” on the Street of Dreams during this holiday-shortened week with a limited audience. While the week of July 4 tends to have an upward bias, if the 1940 – 1950 support level is violated, the Buying Power Index that has been in a downtrend since March (read: lack of Demand) could plummet with a reciprocal rise in the Selling Pressure Index (read: Supply), leaving stocks below the all-important 1940 level mentioned in last Friday’s report.
No positions in stocks mentioned.
Click Here to read the disclaimer >
The information on this website solely reflects the analysis of or opinion about the performance of securities and financial markets by the writers whose articles appear on the site. The views expressed by the writers are not necessarily the views of Minyanville Media, Inc. or members of its management. Nothing contained on the website is intended to constitute a recommendation or advice addressed to an individual investor or category of investors to purchase, sell or hold any security, or to take any action with respect to the prospective movement of the securities markets or to solicit the purchase or sale of any security. Any investment decisions must be made by the reader either individually or in consultation with his or her investment professional. Minyanville writers and staff may trade or hold positions in securities that are discussed in articles appearing on the website. Writers of articles are required to disclose whether they have a position in any stock or fund discussed in an article, but are not permitted to disclose the size or direction of the position. Nothing on this website is intended to solicit business of any kind for a writer’s business or fund. Minyanville management and staff as well as contributing writers will not respond to emails or other communications requesting investment advice.
Visit site:
Jeff Saut: Don't Let This Quiet Week Fool You — Stock Market …
See which stocks are being affected by Social Media

