
Medtronic, Inc. (MDT) news: A Technical Analysis Of Medtronic: Be …
Summary
The author believes MDT to be overbought on a technical analysis basis.
Investors should be prepared to “buy the dip” at a price range of $56-$58.
The author uses Moving Averages, Bollinger Bands, Candlestick Patterns, and the Relative Strength Index to support the analysis.
In my last article on Medtronic (MDT) on 22 December last, I argued that Medtronic had a target price within the $72-90 range, based on the dividend discount model. So far, MDT’s price performance seems to support my theory, trading at a price of $60.41 at the time of writing. This represents a 6.7% return from the initial price of $56.61, in contrast to the S&P 500 return of 2.2% during the same three-month period. In this article, I would like to argue that MDT seems overbought on the basis of technical analysis, and investors should be prepared for a price pullback to approximately $56-$58 to initiate a trade.
Graphs
Analysis
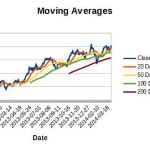
– It can be seen that the 20-day moving average, while initially sloping sharply upwards for the month of February, is slowly beginning to level-off towards the $60 mark. It is my opinion that the stock price may dip in the short run, but will continue to find support at its 50- to 100-day moving average level of approximately $56-$58.
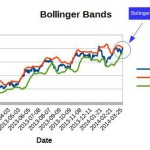
– A Bollinger Band Squeeze appears to be present at the current price level, i.e. this is an indication that price volatility is at low levels, and is a significant indicator of a change in price direction.
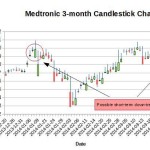
– The candlestick chart (which combines opening, closing, high and low daily prices to reveal further insight into price action) shows the presence of an inverted hammer on two occasions; the first leading to a short-term downtrend. This is somewhat counter-intuitive, as inverted hammer signals are frequently regarded by traders as a bullish signal. Nonetheless, this indicator can be taken as a reasonably reliable indicator of a change in price direction, and investors should be ready for a short-term pullback, as witnessed in the month of January.
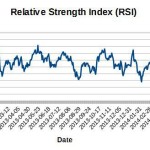
– The Relative Strength Index provides a good indication as to whether a stock is oversold or overbought. Typically, an RSI of 30 indicates that a stock is oversold, and an RSI of 70 indicates it is overbought. We can see that MDT’s current RSI is approximately 61, which approaches overbought territory. Based on past trends, initiating a buy at an RSI within the 35-40 range would seem reasonable.
Conclusion
In conclusion, MDT’s fundamental analysis would suggest that it is a suitable investment for a long-term “buy and hold” investor. However, it is my opinion that both investors looking to lock-in a discount and traders seeking to buy low and sell high should be prepared to capitalize on a possible short-term dip in price, if initiating a position.
Source:
A Technical Analysis Of Medtronic: Be Ready To Buy The Dip
Disclosure: I have no positions in any stocks mentioned, and no plans to initiate any positions within the next 72 hours. I wrote this article myself, and it expresses my own opinions. I am not receiving compensation for it (other than from Seeking Alpha). I have no business relationship with any company whose stock is mentioned in this article. (More…)
From:
Medtronic, Inc. (MDT) news: A Technical Analysis Of Medtronic: Be …
See which stocks are being affected by Social Media

