


Morning technical analysis – 16 January 2014 | Alpari Newsroom …
Morning technical analysis – 16 January 2014
January 16, 2014
by
in
EURUSD
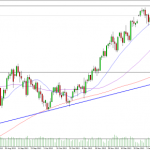
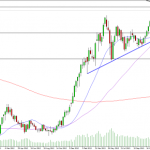
The euro is looking bearish against the dollar once again, following the brief retracement over the last week. The pair ran into strong resistance around 1.3679, from both the 20-day SMA (middle bollinger band) and the 38.2 fib level. After finding resistance here, the pair formed a variation of an evening star formation, with a hanging man and a spinning top in the middle. This is a very bearish setup and despite the early gains seen so far today, suggests there’s plenty more downside to come in the pair. The 4-hour chart also supports this, with the pair having found resistance already today around 1.3625, where the 50-period SMA intersects the 38.2 fib level. Since finding resistance here, we’ve seen the formation of one spinning top and the current candle is looking quite bearish as well. It should be pointed out that the spinning top has formed during a period of low trading volume, which doesn’t make it as strong a reversal pattern as it would during a period of high trading volumes. Therefore we shouldn’t be too surprised if it does break through this level and perhaps test 1.3639, where the descending trend line and 20-period SMA intersect the 50 fib level. Either way, the pair is still looking bearish and I expect it to continue to push lower, with support being found along the way around 1.3580 and 1.3547, previous supports, followed by 1.3522, a previous level of support and the 61.8% retracement of the move from 7 November lows to 27 December highs.
GBPUSD
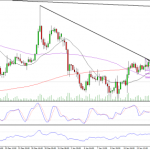
Sterling has been looking more bearish against the dollar over the last couple of weeks, however I still believe this is a short term move. Unless we see a break back below the descending trend line that the pair broke above on 17 December, I will continue to remain bullish in the longer term. That said, that doesn’t mean we’ll see the kind of aggressive rallies that we saw in the second half of last year. Sterling and the dollar are expected to be two of the best performing currency pairs this year, which means we’re probably going to see a lot more of what we’ve seen over the last few weeks, gradual moves higher with regular retracements and times of sideways trading. In the short term, the pair is looking a little more bearish, however it did find strong support yesterday from the 38.2 fib level, which could suggest this is simply a brief retracement. That said, we’ve had another negative start to the session today, which suggests we could see a larger retracement, with the next target being the 50 fib level, around 1.6228. This also coincides with a previous level of support and resistance, and lies just above the important descending trend line, making it a significant level of support. It’s worth pointing out that the pair failed to close below the blue ascending trend line yesterday, which could be viewed as bullish. Although, the fact that we’re seeing further selling today suggests it’s only a matter of time until we see a close below here. This could be an early sign that the market has turned bearish. However, as mentioned earlier, I will need confirmation of this with a close below the descending trend line.
USDJPY
The dollar is looking much more bullish against the yen again, following the brief pull back in the pair. The strong rally on Tuesday brought an abrupt end to the yen rally, resulting in a bullish engulfing pattern, a very bullish setup. The pair also failed to close below the previous resistance level on the weekly chart, which suggests we weren’t seeing a significant retracement, rather a brief pull back followed by a continuation of the move higher. That said, the pair still faces significant resistance just above this year’s highs of 105.43. The first of these comes around 105.58, the 61.8% retracement of the move from June 2007 highs to October 2011 lows. Above here we have the descending trend line, which dates back to August 1998, around 106.50, followed by the 200-month SMA, around 107.27. If we see the first of these taken out, it would be an extremely bullish signal for the pair and could be quickly followed by a break through the other two. Alternatively, this could just be the final push for the pair in the lead up to a double top, with the top being 105.43 and the neckline 103. The reaction at the previous high, 105.43, should tell us which of these it is.
Author: Craig Erlam
Tagged EUR/USD, foreign exchange trading, forex, forex uk, FX, GBP/USD, Metatrader 4, MT4, MT5, Technical analysis, USD/JPY
This article:
Morning technical analysis – 16 January 2014 | Alpari Newsroom …
See which stocks are being affected by Social Media

