


Morning technical analysis – 21 March 2014 | Alpari Newsroom …

Morning technical analysis – 21 March 2014
March 21, 2014
by
in
EURUSD
It’s been a very good couple of days for the US dollar but I must stress, this has been driven almost entirely by the surprisingly more hawkish stance of the Federal Reserve on Wednesday evening, which is dollar bullish. It must be said that this stance doesn’t have any impact on monetary policy in the medium term, and the long term opinions of the officials will probably change numerous times between now and the dates that were being discussed. The reason this is relevant is because, as far as I’m concerned, it makes the recent dollar strength only a temporary move. Before the meeting, this pair was looking quite bullish and had entered into a consolidation period following a strong uptrend. The triangle that formed is a bullish continuation pattern and I don’t think a lot has changed in terms of that bias. We may have seen a retracement instead of a consolidation, which is healthy, but I still believe the pair is bullish. You can see on the charts below that the pair found strong support, both yesterday and today, around the 61.8 fib level, 27 February lows to 13 March highs. Of course, that in itself doesn’t mean the correction is over, but it may do. Especially as it means the pair finding support just above the 200-period SMA on the 4-hour chart, as it did on 27 February. The price action since finding support here hasn’t really convinced me that the correction is over though, it could even be seen as a consolidation, which suggests there’s more downside to come. If this is the case, the next big level for me will be 1.3721, the 50% retracement of the move from 3 February lows to 13 March highs. This also roughly coincides with the previous lows.
GBPUSD
Cable is another pair that has suffered at the hands of the dollar strength since Wednesday night. The difference with this is that some key levels have been broken which points more clearly to a bigger retracement in the pair than above. The neckline of the double top had been providing strong support for the pair in the lead up to the FOMC and this has since been smashed. Based on the size of the double top, this could now prompt a move back towards 1.6360. This level would roughly coincide with the 50 fib level, 12 November lows to 17 February highs. The pair has also closed below the lower bollinger following a squeeze in the bands, which is quite a bearish signal. The 50-day SMA has also been broken. It’s worth mentioning that at the moment, the 61.8 fib level, 5 February lows to 17 February highs, is providing strong support, as is the descending trend line from 17 February highs that it broke above at the end of February, but given everything else, above, I don’t see this holding.
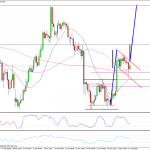
USDJPY
The dollar is looking more bullish against the yen today, but as you can see on the daily chart, it’s been quite messy over the last couple of months, and as of yet, there’s nothing to confirm that this is going to change. Wednesday’s move in the dollar pushed the pair through the neckline of the double bottom and thanks to the strength off the rally, it completed the same move again very quickly. Double bottoms can at times be quite subjective and on this occasion, you could have been more aggressive, as per the double bottom shown in black and still completed the move. In fact, the pair literally rallied to this point before consolidating. The consolidation has led to the formation of a flag, which is typically a bullish continuation pattern. If we see a close above here, the size of the opening to the flag would typically give a conservative target of 102.80, which has previously been support and resistance. The more aggressive target would come from the size of the move from the start of the rally on 19 March to the flag, repeated again above. This would take the pair to 103.75, this year’s highs.
Author: Craig Erlam
Tagged EUR/USD, Fibonacci, Fibonacci Expansion, Fibonacci Retracement, foreign exchange trading, forex, forex uk, FX, GBP/USD, Metatrader 4, Moving Averages, MT4, MT5, Resistance, Support, Technical analysis, Trend line, USD/JPY
Continued:
Morning technical analysis – 21 March 2014 | Alpari Newsroom …
See which stocks are being affected by Social Media

