


Morning technical analysis – 24 January 2014 | Alpari Newsroom …

Morning technical analysis – 24 January 2014
January 24, 2014
by
in
EURUSD
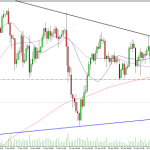
The euro had a very good day against the dollar yesterday, ending the session almost 150 pips up on the day and leaving a very bullish looking candle. Combine this with the previous four candles and what we have is effectively a morning star formation which again is very bullish. On top of this, the pair also broke through the neckline of the double bottom that has formed over the last few weeks. Based on the size of this formation, we should now see a move up towards 1.38. This was previously a key level of resistance. First though we’ll need to see a break above 1.37, where the pair has currently run into resistance. This is the 50% retracement of the move from 27 December highs to 20 January lows, and is also a previous level of resistance for the pair. If the pair breaks through this level then it would confirm that the recent downtrend is over, as the pair is no longer making low highs and lower lows, prompting an initial move towards 1.38, potentially followed by another assault on the descending trend line around 1.3870. First though, it looks like we may see a pull back in the pair following such a strong rally yesterday. This isn’t necessarily a bad thing though. For one, these pull backs allow bullish traders to get in at a better price. They also help confirm the new trend if the pair fails to close below the marabuzo line of the previous candle, as well as the neckline of the double bottom.
GBPUSD
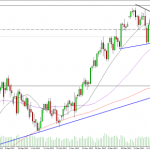
Sterling is looking much more bullish again having failed to close below the 38.2 fib level before rallying and taking out previous levels of resistance and hitting highs not seen since 3 May 2011. The next target for the pair will now be those highs set at the end of April 2011 of 1.6745, although it is currently finding substantial resistance around 1.6635 from the 200-month SMA. This is a huge level of resistance for the pair, with it having only traded briefly above the 200-month SMA on a few occasions over the last four years. If we see a significant break above it would be an extremely bullish signal. As it stands we’re not seeing any real indication that the pair is going to pull back at all. At the very least what we’re seeing is consolidation which would normally be bullish if anything. If we do see a pull back then support should initially be found around 1.66, a previous level of resistance, followed by 1.6515, the 38.2% retracement of the move from 17 January lows to yesterday’s highs and also a previous level of resistance.
USDJPY
Yesterday’s dollar weakness was also felt against the yen, which fell back towards the 50-day SMA before finding support. The pair failed to break below the previous low, around 102.85, on this occasion which may suggest that all we’re seeing this year is more consolidation in the pair. Had it broken through those previous lows, the pair would now be making lower highs and lower lows, which means it would technically be in a downtrend, but that is not the case. On the 4-hour chart we’ve now seen a bullish engulfing pattern form around this support level, followed by a failed attempt to close below the opening level of the green candle. This suggests the market is determined to protect this level which is a very bullish signal. A key level for the pair today will be 103.87. This is the mid-point of the previous candle as well as a previous level of support for the pair. If it fails to close above here, we could see further downside in the pair in the coming days and further pressure on the bottom of the triangle that has formed this year. A break below here looks unlikely at this stage but if we see it, it would be very bearish and suggest we’re going to see a much bigger retracement, of the the strong rally from October, than we’ve already seen. A close above 103.87 would result in a piercing pattern, which isn’t the most bullish pattern, but it is a bullish signal. We would still require confirmation of the bullish move, with a close above yesterday’s open, but it would at least suggest that we’re going to see further pressure on the top of the triangle.
Author: Craig Erlam
Tagged EUR/USD, foreign exchange trading, forex, forex uk, GBP/USD, Metatrader 4, MT4, MT5, Technical analysis, USD/JPY
See the article here –
Morning technical analysis – 24 January 2014 | Alpari Newsroom …
See which stocks are being affected by Social Media

