
Morning technical analysis – 25 February 2014 | Alpari Newsroom …
Morning technical analysis – 25 February 2014
February 25, 2014
by
in
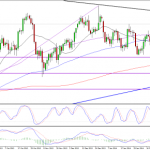
EURUSD
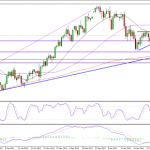
We’ve seen some consolidation in this pair over the last week or so, ever since it failed to make new highs for the year, having come within a couple of pips of the 2 January highs. This level has been tested, and held, a few times recently, which could be viewed as bearish as this is clearly a significant level of resistance. However, I remain bullish as the pair has continued to make higher highs throughout this time. This has resulted in an ascending triangle formation which is typically a bullish setup, whether formed in an uptrend or a downtrend. Of course, there are no guarantees and this could still break lower, but I’ll need to see a close below the triangle before I see this as a likely outcome. With the top of the triangle coinciding with this year’s highs, any break above could be fairly aggressive, prompting quite a rapid move towards 1.3810, a key level of resistance towards the end of last year, followed by 1.3840, where the descending trend line should provide significant resistance again.
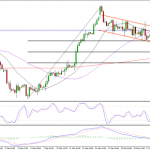
GBPUSD
Sterling is looking a little bullish again this morning, although the lack of momentum gained yesterday after opening above Friday’s close is a slight concern. The pair found strong support around the 38.2 fib level over the last couple of days and has started to edge higher but we’re still lacking the confirmation that could prompt a more aggressive push back towards last week’s highs. That could come very soon with a break above the flag formation on the 4-hour chart, although for now, the top appears to be providing significant resistance for the pair. This isn’t the perfect example of a flag formation, but I think the message is still the same. We’re still seeing consolidation following an aggressive move higher, therefore I still view this as a bullish continuation pattern. If we see a break above, the next major level of resistance should come around the previous highs of 1.6822, with resistance potentially coming along the way around 1.6730.
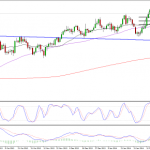
USDJPY
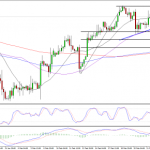
We’re still seeing consolidation in this pair, having failed to see a break above the ascending triangle in the last couple of sessions, despite numerous attempts. Regardless of these failed attempts, I remain bullish and think it’s just a matter of time until the pair breaks higher. That said, this is purely based on the size of the correction so far and the ascending triangle that has formed in recent weeks, a bullish pattern. Should we see a daily close below the ascending triangle, this bullish view would quickly change. For now, we’re still waiting for confirmation that the correction is over which should come soon, with a break above the triangle. If we do see a break higher, further resistance should be found around 102.93 and 103.43.
Author: Craig Erlam
Tagged EUR/USD, Fibonacci Retracement, foreign exchange trading, forex, forex uk, FX, GBP/USD, Metatrader 4, Moving Averages, MT4, MT5, Resistance, Support, Technical analysis, Trend line, USD/JPY
Continue reading:
Morning technical analysis – 25 February 2014 | Alpari Newsroom …
See which stocks are being affected by Social Media

