
Morning technical analysis – 25 March 2014 | Alpari Newsroom …
Morning technical analysis – 25 March 2014
March 25, 2014
by
in
EURUSD
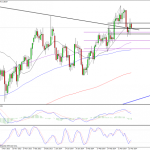
Despite having a good couple of days, I’m not convinced that the retracement in this pair has been completed. The pair rallied since finding support from the 61.8 fib level, 27 February lows to 13 March highs, but at the moment, this is looking more like a correction in the short term downtrend, rather than a continuation of the uptrend. As you can see on the 4-hour chart, the pair broke through the neckline of a double bottom, prompting a move towards 1.3875, based on the size of the formation. This level coincided with a previous level of support. Once this had been completed, the pair started heading south again which suggests yesterday’s rally was just a correction. This will be confirmed if the pair breaks through last week’s support around 1.3750. This would also mean a break of the 200-period SMA on the 4-hour chart. If we see this, the next major support should come around 1.3721, the 50% retracement of the move from 3 February lows to 13 March highs. This also coincides with a previous level of support.
GBPUSD
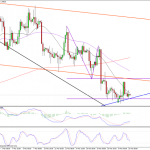
We had a bit of a correction in this pair yesterday but it ran into resistance around the 50 fib level, 5 February lows to 17 February highs, before erasing most of the days gains before the end of the session. This suggests to me that the correction is already over and we may see another move to the downside in the coming days. This would mean a break of the ascending trend line, which dates back to 12 November, and the 61.8 fib level. The next major support for the pair should then come around 1.6337. This is the 50% retracement of the move from 12 November lows to 17 February highs, a previous level of support and the projected target of the double top that it broke below last week, which itself is based on the size of the formation. The pair may find temporary support along the way around 1.6439 and 1.6372, the 123.6% and 161.8% expansion levels, respectively, of the move on the 4-hour chart, having already found support and resistance from the 61.8% and 100% fib expansion levels.
USDJPY
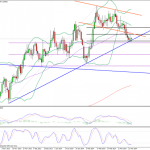
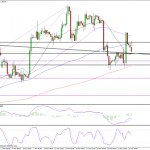
The dollar has traded sideways over the last few days, but I believe that is about to change. While the daily chart, below, doesn’t necessarily give that impression, although it does provide some key levels to watch, the 4-hour chart does. The pair got a significant boost when it broke above the double bottom, which based on the size of the formation propelled it to 102.67. The consolidation that followed led to the formation of a flag, a bullish continuation pattern. While the break above this hasn’t been as aggressive as it can be, the failure to break below the 38.2 fib level does suggest it will still materialise. The initial target, based on the size of the flag entry hasn’t yet been met and would coincide with a previous level of resistance. This resistance, which can also be seen on the daily, has previously been quite strong making a break of it very bullish. The aggressive target, based on the size of the flagpole, would come around 103.72 and coincide with the previous high.
Author: Craig Erlam
Tagged EUR/USD, Fibonacci, Fibonacci Expansion, Fibonacci Retracement, foreign exchange trading, forex, forex uk, FX, GBP/USD, Metatrader 4, Moving Averages, MT4, MT5, Resistance, Support, Technical analysis, Trend line, USD/JPY
Link –
Morning technical analysis – 25 March 2014 | Alpari Newsroom …
See which stocks are being affected by Social Media

