


Morning technical analysis – 26 February 2014 | Alpari Newsroom …

Morning technical analysis – 26 February 2014
February 26, 2014
by
in
EURUSD
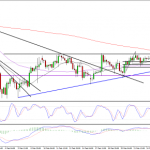
There was quite a lot of choppiness in this pair at times yesterday and yet it still never managed to break out of the ascending triangle it entered a week ago. At one point there was plenty of pressure on the bottom of the triangle but a significant break never came, which I believe was a bullish signal. This was also the third test of the bottom of the triangle which confirmed it as a legitimate level of support. The pair is now almost trading two thirds of the way into the triangle, which tends to be the point at which we see a breakout. With it being an ascending triangle, this tends to be a break higher, which on this occasion would be consistent with the trend. The next major levels of resistance would then come around 1.3810, a major level of resistance in the final few months of last year, followed by 1.3840, descending trend line which dates back to 15 July 2008.
GBPUSD
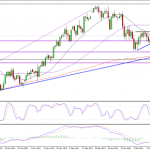
Sterling broke above the descending channel that it had been trading in yesterday but it has since failed to gather any upward momentum. The pair quickly ran into resistance around 1.6720 before paring its gains. Importantly, while the pair hasn’t broken aggressively higher, it has found support along the top of the channel since breaking above it. This could be viewed as confirmation of the break and therefore bullish. The most recent support is also a previous level of resistance and falls on the 20-period SMA. While the pair is looking bullish, I would like to see confirmation of this with the break above the next trend line around 1.6690. If we see this, further resistance could be found around 1.6725, followed by 1.6740. The next major level of resistance then comes around 1.6820 so the move between these two levels could be quite aggressive.
USDJPY
We’re continuing to see consolidation here following another failed breakout yesterday. The pair is now trading around two thirds of the way into the formation, which is usually around the point when we see a breakout. I still expect this to come to the upside, as we tend to see with an ascending triangle formation, even in a downtrend. If we do, it would effectively mark the end of the correction seen since the turn of the year and suggest we’re going to see a move back towards this year’s highs of 105.43. Above the triangle, resistance could be found around 102.90, previous resistance, 103.30, 50-day SMA, and 103.45, previous resistance.
Author: Craig Erlam
Tagged EUR/USD, Fibonacci Retracement, foreign exchange trading, forex, forex uk, FX, GBP/USD, Metatrader 4, Moving Averages, MT4, MT5, Resistance, Support, Technical analysis, Trend line, USD/JPY
Visit site –
Morning technical analysis – 26 February 2014 | Alpari Newsroom …
See which stocks are being affected by Social Media

