


Morning technical analysis – 27 February 2014 | Alpari Newsroom …
Morning technical analysis – 27 February 2014
February 27, 2014
by
in
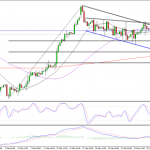
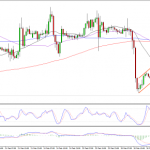
EURUSD
The euro is looking much more bearish against the dollar this morning, having broken below the ascending triangle yesterday, before briefly consolidating and breaking lower again. As mentioned previously, ascending triangles tend to be bullish but this is not always the case. Occasionally, we will get a break below an ascending triangle and this just happens to be one of those times. The pair was facing significant resistance just above the triangle, which it appeared unlikely to break above, which may explain why it broke lower on this occasion. Regardless, having broken through, the pair temporarily found support around 1.3667, the 50% retracement of the move from 12 February lows to 19 February highs. The consolidation that followed led to the formation of a flag, a bearish continuation pattern, which didn’t take long to break. With the previous lows and the 100-period SMA on the 4-hour chart now broken, the pair is now finding support around 1.3650, from the 20 and 50-day SMAs, and further support should come around 1.3642, 61.8% retracement of the above move, 1.3636, 200-period SMA on the 4-hour chart and 1.3625, from the 100-day SMA.
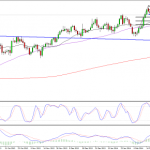
GBPUSD
We’re continuing to see consolidation in the pair this morning, but there’s no sign yet that we’re going to see a breakout. Usually this breakout will come to the upside, in line with the prevailing trend, but as always there is not guarantee. I still think we will see a break higher though, it’s just a case of when. The pair still hasn’t closed below the 38.2 fib level, 5 February lows to 17 February highs, which strikes me as quite a bullish signal. As with all of these consolidation patterns, we’ll need to see a close outside the flag to confirm the bullish or bearish outlook.
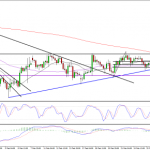
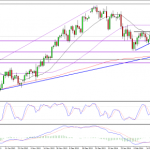
USDJPY
Another pair that has been stuck in a consolidation period for a while now is the dollar against the yen. We’ve seen a correction in this pair since the start of the year, with it retracing 50% of the move from 8 August lows to 2 January highs in that time. Since finding support around 100.60, the pair has formed an ascending triangle which ordinarily would be a bullish reversal pattern. We haven’t yet see a breakout to either confirm this or point to a continuation of the downtrend, but it can’t be far away. The pair is now more than two thirds of the way into the pattern, the point at which we normally see a breakout. Based on what usually happens, I can only assume that a breakout is imminent. On the 4-hour chart the 200-period SMA is now also providing significant resistance on the top of the triangle. If we see a close above this, it would make it even more bullish in my view, with the next resistance levels coming around 103.30, 50-day SMA, and 103.43, previous high.
Author: Craig Erlam
Tagged EUR/USD, Fibonacci Retracement, foreign exchange trading, forex, forex uk, FX, GBP/USD, Metatrader 4, Moving Averages, MT4, MT5, Resistance, Support, Technical analysis, Trend line, USD/JPY
Source:
Morning technical analysis – 27 February 2014 | Alpari Newsroom …
See which stocks are being affected by Social Media

