


Morning technical analysis – 28 February 2014 | Alpari Newsroom …
Morning technical analysis – 28 February 2014
February 28, 2014
by
in
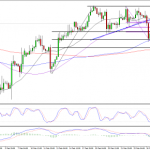
EURUSD
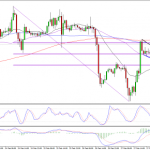
The euro has looked a little more bullish over the last 24 hours, following the sell-off that saw it break below the ascending triangle on Wednesday. The only question now is whether the move in the last 24 hours is a correction of Wednesday’s move, or whether the initial sell-off just represented a bigger correction of the longer term uptrend. There is a clear argument for the former, with the pair having found resistance from a combination of the 20-period SMA and 50-period SMA on the 4-hour chart, and the 61.8 fib level, this week’s highs to lows. That said, as it stands it’s looking like the latter, although confirmation is needed. The pair found strong support from the 61.8 fib level, 12 February lows to 19 February highs, yesterday before rebounding aggressively higher. This would suggest the pair was only completing a retracement on Wednesday and the longer term uptrend is still in tact. You can also see the bullish descending wedge on the hourly chart, which the pair broke above this morning. This bullish outlook should be confirmed if we get a close above 1.3722 and make new highs, having made new higher lows earlier this morning.
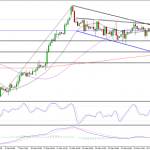
GBPUSD
After around 11 days of consolidation, sterling looks to have finally broken higher against the dollar this morning, having forced its way through the top of the flag formation. It has also taken out another trend line along the way as well as a number of previous highs. Assuming we get a close above here this would be quite bullish and I’d expect to see it move towards 17 February highs of 1.6822. There’s very little resistance between the current level and that so the move could be fairly rapid.
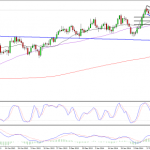
USDJPY
The dollar has been trading in an ascending triangle against the yen, ordinarily a bullish reversal pattern following a downtrend. However, in the last couple of days, we’ve seen a lot of pressure on the bottom of the triangle, with the pair spending a large part of yesterday trading below. It did eventually close back inside the triangle on the daily chart, but today we’re seeing another breakout attempt and I very much doubt at this stage that this one won’t be successful. On the 4-hour chart, yesterday’s recovery into the end of the session actually looks more like a retest of the triangle as a new level of resistance, which would only add to the bearish outlook this pair now has. Already, we’ve seen it take out a previous level of support, 101.70, and it now appears to be closing in on the next support, around 101.38. If the pair ends the day below here, which it looks likely to do, I expect the next significant support level to be this year’s lows of 100.75. Further support would then come around 100.60, 50% retracement of the move from 8 August lows to 2 January highs, and a previous level of resistance.
Author: Craig Erlam
Tagged EUR/USD, Fibonacci Retracement, foreign exchange trading, forex, forex uk, FX, GBP/USD, Metatrader 4, Moving Averages, MT4, MT5, Resistance, Support, Technical analysis, Trend line, USD/JPY
More here:
Morning technical analysis – 28 February 2014 | Alpari Newsroom …
See which stocks are being affected by Social Media

