


Morning technical analysis – 7 April 2014 | Alpari Newsroom | Live …
Morning technical analysis – 7 April 2014
April 7, 2014
by
in
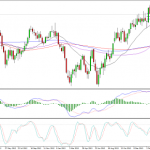
EURUSD
The euro is looking a little more bullish this morning, having found strong support on Friday around 1.3663, the 61.8% retracement of the move from 3 February lows to 13 March highs. The failure the break below this level could be a sign that the correction seen over the last few weeks has played out but I’m still not convinced. While Friday’s candle looks a little bullish, it’s far from convincing, having still ended the day lower to not even create a hammer, or something similarly bullish. The response this morning while being positive is not indicative of a market that is bullish following the completion of a correction. This should be confirmed in the coming days by the pair’s ability, or inability, to make new highs, breaking last week’s 1.3820. A break of this level would suggest that the longer term bullish trend has resumed. A failure on the other hand would suggest this period of weakness is far from over.
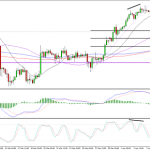
GBPUSD
Sterling is looking a little more bullish against the dollar at the moment, but the lack of upward momentum is still a concern. The pair failed to significantly break below the marabuzo line of the previous weeks candle which is quite a bullish signal, especially as it comes off the back of the pair finding support from the ascending trend line, 61.8 fib level and 20-week SMA. However, as already mentioned, the pair has not taken off as you’d expect from a bullish bounce off a key support level. I think we need to see new highs being made, above 1.6683, before we see any significant gains being made. Clearly traders are unconvinced so far and require some confirmation hat the recent downtrend is over.
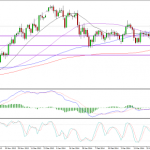
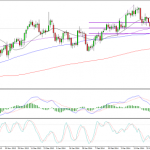
USDJPY
Last week’s shooting star candle on the weekly chart would suggest the correction in this pair is far from over. Last week’s correction didn’t come as a huge surprise, following the powerful rally in the pair which saw it break many resistance levels including the 7 March highs. The pair looks destined to reach this year’s highs of 105.43, but this correction is a reminder that the rally may not be aggressive as some we’ve seen in the past. The bearish divergence on the 4-hour chart on Thursday was a good signal for the correction, especially as it came alongside a negative cross on the MACD. Now both of these oscillators are pointing to a bullish reversal, with the MACD showing a loss of downward momentum and the stochastic crossing in oversold territory. That said, I think this may be a short term move with more potential downside to come before we see the pair rally back towards this year’s highs. If we do see it trade lower, further support could be found around 102.91, 50% retracement of the move from 27 March lows to 4 April highs, and 102.63, 61.8% retracement of the same move.
Author: Craig Erlam
Tagged EUR/USD, foreign exchange trading, forex, forex uk, FX, GBP/USD, Metatrader 4, MT4, MT5, Technical analysis, USD/JPY
More here:
Morning technical analysis – 7 April 2014 | Alpari Newsroom | Live …
See which stocks are being affected by Social Media

