
Morning technical analysis – 7 February 2014 | Alpari Newsroom …
Morning technical analysis – 7 February 2014
February 7, 2014
by
in
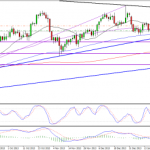
EURUSD
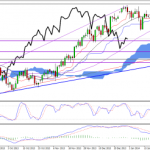
The euro is edging lower again this morning, after spiking higher yesterday following Mario Draghi’s surprisingly hawkish press conference. The pair failed to close above 1.3608, the 50% retracement of the move from 24 January highs to 3 February lows, as well as the 20 and 100-day SMAs, having reached highs just below the 200-period SMA on the 4-hour chart. Clearly there is significant resistance around this level but that doesn’t mean it won’t be broken in the coming days. That said, the pair does still remain in a downtrend having recorded lower lows and lower highs since the end of last year. If we see a break back below the ascending trend line, which dates back to 6 September, that the pair broke back above during yesterday’s rally, it would suggest that the move higher was only temporary. This would be confirmed if the pair breaks below 1.3476, this week’s lows. Below here further support should be found around 1.3458, 38.2% retracement of the move from 9 July lows to 27 December highs, 1.3380, 200-day SMA, and 1.3324, 50% retracement of the above move. Alternatively, a break above all of the resistance levels highlighted above, as well as the previous highs of 1.3739, would suggest this brief downtrend is over and the uptrend is going to continue.
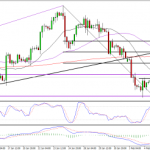
GBPUSD
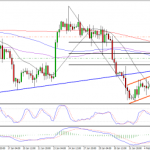
Sterling is pushing a little higher this morning following three sessions in which the pair has been stuck in a very tight range. This doesn’t appear to be too much of a case of a battle going on between bulls and bears, as much as it is slightly lower trading volumes and potential uncertainty ahead of today’s hugely important non-farm payrolls figure which I’m sure will significantly widen the trading range. What is important is that throughout this week, 1.6260, 50 fib level and previous support and resistance, has held up as a significant level of support. This suggests that despite the lack of gains in the pair, the market is still bullish an clearly keen to protect this level. As we can see on the 4-hour chart, the pair has broken above the resistance level, set over the last few days, although it is yet to close above here. If we do see a close above this level, it should prompt a move towards 1.64, with further resistance then being found around 1.6417, 50-period SMA on the 4-hour chart, and 1.6438, 200-period SMA on the same chart. On the daily chart the 50-day SMA could also provide resistance around 1.6411, as well as the 38.2 fib level, with the 20-day SMA above here providing further resistance around 1.6439. I should point out though that with the markets currently being in somewhat of a sideways trend, particularly on the daily chart, these moving averages do tend to be less reliable than when the pair is trending.
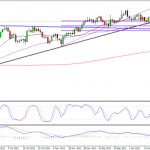
USDJPY
The dollar is looking more bullish against the yen this morning, despite trading slightly lower on the day. In recent days the pair has rebounded nicely off the 50 fib level, the move from 8 August lows to 2 January highs, closing above Senkou Span B on each day, before breaking through two descending trend lines on the 4-hour chart. The pair is finding resistance this morning around 102.10, the 50% retracement of the move from 29 January highs to 4 February lows, with the 50-period SMA on the 4-hour chart and the Tenkan-Sen on the daily also currently blocking a move higher. If we see a break above here, the pair should find further resistance around 102.40, 61.8% retracement of the shorter term move and a previous level of resistance. Above here further resistance should be found around 103.
Author: Craig Erlam
Tagged EUR/USD, foreign exchange trading, forex, forex uk, FX, GBP/USD, Metatrader 4, MT4, MT5, Technical analysis, USD/JPY
Continued here:
Morning technical analysis – 7 February 2014 | Alpari Newsroom …
See which stocks are being affected by Social Media

