

Morning technical analysis – 8 November 2013 | Alpari Newsroom …
Morning technical analysis – 8 November 2013
November 8, 2013
by
in
EURUSD
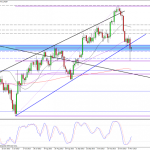
This pair is trading a little higher this morning, as it continues to pare some of yesterday’s huge losses. The pair fell 200 pips following the ECB rate decision, which came on top of another 200 pip drop over the last week on speculation of such a rate cut. The collapse in the euro has put an end to the clearly defined up trend that the pair had been in since July. The bearish market bias may be confirmed in the coming days if the pair attempts, and fails, to break back above the ascending trend line around 1.3465. That said, it may not get that far, having found resistance yesterday around 1.3450, 61.8% retracement of the move from Wednesday’s highs to yesterday’s lows. For now, the pair is finding resistance around 1.3420, the 38.2% retracement of the move from July’s lows to this year’s highs, having found strong support yesterday around the 50% retracement level from the same move. The next levels of resistance for the pair should come around 1.3450 and 1.3465, while support should be found around 1.34, followed by 1.3385, 1.3324 and 1.3293, 50 fib level.
GBPUSD
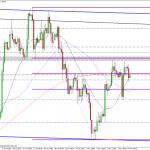
Sterling is trading lower this morning, having found resistance on Wednesday around 1.6120. This is where the ascending trend line, that the pair broke below on 30 October, intersects the 61.8 fib level, of the move from 23 October highs to 4 November lows. This is quite a bearish signal for the pair and points to some long overdue dollar strength going forward. That said, we’re still not seeing any aggressive selling in this pair yet, which suggests to me that we could see some more attempts at a push higher by the bulls before any move lower. For me, confirmation of the bearish bias will come once the neckline of the double top is broken, around 1.59. In the mean time, resistance should be found around 1.6077, from the 200-period SMA on the 4-hour chart, 1.6115, 1.6123 and 1.6136. If we see a move lower, support should be found around 1.6062, 1.6009, 1.5990, 50-day SMA, 1.5948 and 1.59.
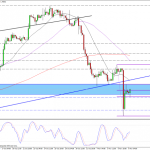
USDJPY
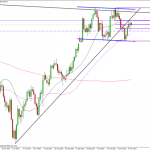
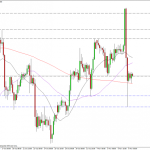
Despite seeing plenty of volatility in the pair yesterday, which saw it break above the descending trend line dating back to 22 May, the pair is back trading within the triangle again today. There’s clearly still a lot of indecision in the pair with traders still appearing to favour a break above than below. That said, yesterday’s move shows that it’s still not the time and we’re likely to see more sideways trading in the coming weeks, with the range continuing to shrink. Very little has actually changed in this pair following yesterday’s move. The pair is now finding resistance around 98.1, which has previously acted as support. This also coincides with the 20-day SMA (middle bollinger band). Further resistance should be found above here around 98.46, followed by 99, from the descending trend line. This is also a previous level of support and resistance. If the pair turns lower, support should be found around 98, 200-period SMA on the 4-hour chart, 97.80 and 97.60.
Author: Craig Erlam
Tagged EUR/USD, foreign exchange trading, forex, forex uk, GBP/USD, Metatrader 4, MT4, MT5, Technical analysis, USD/JPY
This article is from –
Morning technical analysis – 8 November 2013 | Alpari Newsroom …
See which stocks are being affected by Social Media

