

NEW: Technical Analysis of Women in Jars! (GLD, GS) – Oakshire …

We’re going to open this week with a discussion of one aspect of market psychology that we hope you’ll find interesting.
We believe it’s worthy of discussion because it happens often enough to be chartable, and, to a fairly great degree, its outcome is also predictable.
It’s quite simply the phenomenon of the sideways moving market.
Time Frames and Market Patterns
We should be quick to point out that by ‘sideways moving’ we don’t mean a stock that’s locked in a trading range for a few hours or a few days. Short term patterns are notoriously unreliable and anyone who attempts to build a trading system using technical configurations from an hourly or even a daily chart over the short term will most likely end up bankrupt.
Technical analysis is rather a discipline that’s most useful for the practitioner with an eye to the long term, with diminishing efficacy as the time frame shortens. To attempt to trade stocks using intraday patterns, or even those formed over a few days or a week – without taking into consideration the broader technical sweep, and employing weekly and monthly charts in one’s analysis – is to court disaster.
And that’s not our purpose here.
Wisdom in a Bottle
With that in mind, let’s step back somewhat and take a look at two charts that show a longer-term sideways drift in the making and see what we can learn.
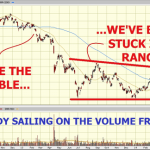
We’ll start with the following, a chart we’ve deliberately made anonymous by removing the ticker from the upper left corner. When our analysis is complete, we’ll take off the blindfold and reveal to you the culprit’s true identity.
This is two years worth of stock X, a company that took a steep dive 20 months ago but that’s held in a tight range for a full year ever since (between the red lines).
And the question therefore needs be asked – is the sideways motion indicative of a bottom, or just a pause in the action before the selling recommences.
But before we address the question, let’s look at the inverse situation.
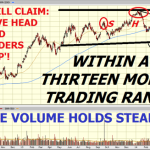
Below is two years worth of stock Y, a company that had been moving strongly before falling into a slump just this year.
The current sideways move is being called a head and shoulders top by many (in red) and it certainly could be construed that way.
But is it?
Is this a stock that’s about to experience a wholesale trend reversal – as a genuine H&S pattern indicates? Or has it just paused on its way toward setting new highs?
The Psychology of the Sideways Move
After a period of prolonged entrenchment such as that exhibited by the two stocks above, it’s natural for investors to believe that either the long term tide of the stock has turned, or, at the very least, that we’re in for an intermediate trend reversal that lasts anywhere from several months up to a year and a half.
So, for instance, the first chart gives the distinct impression that the decline in stock X is now complete and that a long trade would be in order.
Conversely, a gander at stock Y’s chart ostensibly tells us that the party’s kaput and a short of the company’s shares would offer significant profits.
So how do we know if these reads are legitimate and not the product of a faulty interpretation of the charts – an analysis that’s been tainted by psychological factors that toy with our diagnostic acumen (not to mention our emotions)?
And the answer is as follows.
[Why are they always in bottles?]
It’s volume.
What?
You heard right – volume.
Volume?
Yup. Volume.
That is, we can measure the chances of a reversal in trend by the amount of stock that turns over during a sideways drift like those illustrated above. The greater the turnover, the greater the likelihood the stock is exiting the hands of those who formerly held it and is moving on to new owners.
In the case of the first chart, X, which is, in fact, GLD, the SPDR Gold Trust, we see no appreciable pick-up in volume as the stock moves through its latest trading range. That means the stockholders from the previous down-move are still hanging on. They haven’t reached a point of desperation, and there has been no accumulation of stock by new buyers eager to step in and take shares away from those ready to capitulate.
The second stock, Y, which is Goldman Sachs Group Inc. (NYSE:GS), one of the most powerful financial firms on the planet, also shows no evidence of turnover. The former cadre of stockholders has been perfectly pleased to hold their shares through the stock’s funk, and was decidedly unwilling to distribute their shares at the last high that occurred around New Years.
All of which indicates that –
1) Gold has not bottomed and should continue to fall, and
2) Goldman Sachs (and the rest of her financial brothers-in-arms) likely have more upside ahead.
Trades, Huey! Give us some trades.
You got it.
But first, we’re going to report a trade that expired last week and gave us a bonanza of cash.
We wrote about it in a letter dated May 12th called A Gold Pen! My Kingdom for a Gold Pen, in which we sold six GLD May 127 CALLs (May 30 expiry), then priced at $0.53, for a total credit of $3.18.
The chance of a rebound for gold at that time, we felt, was next to nil.
As of this weekend, GLD was, indeed, tumbling mightily, and we pocketed the full $318 per round traded.
Congratulations to all those who got it on.
And this week?
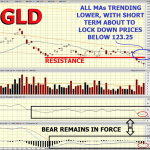
Does gold have a chance to rebound from current levels?
We don’t see it.
With all her moving averages trending lower and just a day or two from being unfurled completely, we see an overhead lock on the stock at roughly $123.50 (blue circle, below).
Take a look –
Also RSI and MACD are both below their waterlines (in black).
Unless GLD shoots up strongly above $124 by mid-week, turn out the lights.
And while you’re at it –
Wall Street Elite recommends you consider selling GLD June 124 CALLs for $0.41 each and buying GLD July 112 PUTs for $0.42. Total debit on the trade is $0.01 per round traded.
With kind regards,
Hugh L. O’Haynew, Senior Analyst, Oakshire Financial
Related Articles
04/28/14 Measuring the Worry one Cup at a Time (GMCR, TSLA)05/01/14 A FaceBergZucker is Born (FB)04/07/14 Prying Profits from a Return to Risk (FB, IXP, TSLA)03/15/13 Carnival (CCL) Down Despite 4Q Profits01/15/10 Trading Shanda For Profit…03/09/10 Profiting from Downside Out-Performance…
View article:
NEW: Technical Analysis of Women in Jars! (GLD, GS) – Oakshire …
See which stocks are being affected by Social Media

