
Official MetaStock Blog: TechniTrader Weekly Stock Discussion for …
MetaStock® SPRS Series – Week 154 – January 17, 2014 – MetaStock Spatial Pattern Recognition Skills Series written by Martha Stokes CMT
Most retail investors and retail traders do not realize that they have a huge advantage over the professional side of the market. This is due to the constraints, restrictions, rules, and regulations the professional side must comply with on an ongoing basis. It is also due to the fact that 80% of the professionals still do not use Technical Analysis.
Stock Charts are the graphical representation of what the market participant groups who use fundamentals understand about that stock and its company at that time.
What retail investors and retail traders need to learn is how to interpret the stock charts with the understanding that there are 9 primary market participant groups, and each one buys the stock at a different time during the up, down or sideways price action. Over a year or longer time period different market participant groups will be highly active, or not buying the stock at all. When one or two market participant groups are heavily buying or selling a stock, this is called “controlling the stock price.” Each market participant group controls price in a specific way creating easy to identify trendline patterns. When a retail investor or retail trader can identify who is in control they will know how to trade the stock, which trading style and strategy will work best, when to enter the stock, how long to hold the stock, and when to exit the stock.
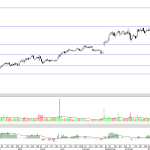
Let’s study the chart below and learn how to interpret the candlestick patterns and trend line patterns, to learn to identify who is controlling price on this stock chart.
What is very obvious immediately is how precise and consistent the sideways pattern is over time. What is also noticeable are the gaps that follow the sideways pattern.
Sideways price action that is precise means that the buyers are dominant, have a huge amount of capital reserves, buy with a controlled bracketed order that contains price in a narrow range, and eliminates momentum action and volatility. There is also an incremental pattern in the sideways action. Each sideways pattern prior to the gap or run up is nearly equal in time duration.
This is the pattern that giant lot institutions create when they use Dark Pool Alternative Trading System platforms to slowly accumulate millions of shares of stock. The more giant funds that buy the stock, the more consistent the platform pattern will be. Dark Pools are buying in incrementally over time and control price during their accumulation phase.
Once the Dark Pools have completed their buying for that price level it is obvious that High Frequency Traders HFTs automated orders trigger, driving price up. High Frequency Traders can also make mistakes as was the case in July with the attempted to sell down the stock during accumulation, as shown by the red volume spike that month. The smaller funds always chase HFT action. Often retail traders also chase HFT action too, not understanding the market participant group cycle and how it affects the trend, and trendline patterns that form over time.
The stock was under heavy accumulation at the time the HFT triggered order attempted to sell off. Since the giant funds have massive capital bases and a controlled order to buy incrementally their orders overwhelm the HFT sell short orders rapidly and the stock continues to move up many months after that attempt.
Learning to identify who is controlling price at any given time, tells the retail investor or retail trader a huge amount of information that is not available in retail news, guru recommendations, or friends and co-workers opinions about stock trading.
To be consistently successful, retail investors and retail traders must learn and understand the Market Participant Group Cycle and how that affects the stock trend over time. When you use this methodology, your success at investing and trading will improve rapidly and consistently.
Visit our TechniTrader Learning Center to learn more about Chart Training here: http://goo.gl/t60Vfh
Trade wisely,
Martha Stokes CMT
Chartered Market Technician
Member of Market Technicians Association
Master Rated Technical Analyst for Decisions Unlimited, Inc.
Instructor and Developer of TechniTrader Stock Market Courses
For additional training visit http://technitrader.com
This Stock Discussion and Training Lesson is sponsored by TechniTrader.com
MetaStock® Partner
©2014 Decisions Unlimited, Inc. All Rights Reserved.
TechniTrader is the Registered Trademark of Decisions Unlimited, Inc.
Disclaimer: All statements, whether expressed verbally or in writing are the opinions of TechniTrader and its instructors or employees, and are not to be construed as anything more than an opinion. Student/subscribers are responsible for making their own choices and decisions regarding all purchases or sales of stocks or issues. At no time is any stock or issue on any list written or sent to a student/subscriber by TechniTrader and its employees to be construed as a recommendation to buy or sell any stock or issue. TechniTrader is not a broker or an investment advisor it is strictly an educational service.
View original:
Official MetaStock Blog: TechniTrader Weekly Stock Discussion for …
See which stocks are being affected by Social Media

