
Profit Margins And Stock Market Reversions | Zero Hedge
Over the weekend, Jesse Livermore wrote an excellent piece on how we should view profit margins. The piece is very long and detailed but makes a very good case on the proper measure of calculating profit margins due to the impact of globalization.
“Now, you might ask, to calculate the profit margin, why do we only include final sales to end users, instead of all corporate sales? The answer is to avoid double-counting the same output and revenue.
Intermediation is the reason that the profit margins are substantially higher than the profit margins in the S&P 500. The profit margins calculated in the S&P 500 chart count the same output and revenues more than once, because some corporations in the S&P 500 are intermediary producers for and customers of other corporations in the S&P 500. Also, not all of the profit earned in the value-added chain of S&P 500 companies is counted, because not all intermediate and final producers in that chain are members of the S&P 500 (or even publically-traded).
The following chart, which is the only accurate NIPA chart of net profit margins for the macroeconomy, and [should be] the only NIPA chart that anyone should be citing in this debate.”
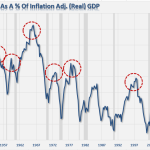
With Jesse’s analysis, we can now look at corporate profit margins versus inflation adjusted GDP. As you can see in the next chart, the current level of profit margins, as a percent of the economy, are certainly elevated. However, not to the extreme nature that using nominal GDP would produce.
Importantly, what we find from this study is that profits, as a percentage of the real economy, tend to peak prior to the onset of recessions. However, the span between peaks in profits and recessions was greater during the 80’s and 90’s. This was due to the massive increases in consumer debt, falling interest rates and inflation that supported economic growth for periods longer than would have been the case otherwise. I discussed this exact point recently:
“There were several contributing factors that drove that particular secular bull market [1980-2000]:
1) Inflation and interest rates were high and falling which boosted corporate profitability.
2) The extreme negative sentiment of the late 70’s was finally undone by the early 90’s. (At the turn of the century, roughly 80% of all individual investors in the market began investing after 1990. 80% of that total started after 1995 due to the investing innovations created by the internet. The majority of these were “boomers.”)
3) Large foreign net inflows to chase the “tech boom” drove prices to extreme levels.
4) The mirage of consumer wealth, driven by declining inflation and interest rates and easy access to credit, inflated consumption, corporate profits and economic growth.
5) Corporate profits were boosted by deregulation of industries, wage suppression, outsourcing and productivity increases.
6) Pension funding requirements and accounting standards were eased which increased corporate profits.
7) Stock based executive compensation was grossly expanded which led to more “accounting gimmickry” to sustain stock price levels.
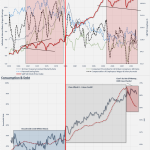
The dual panel chart below shows the economic fundamentals versus the S&P 500 and the change that occurred beginning in 1983. (Red dividing line)”
Corporations continue to push the boundaries of wage and employment suppression, productivity increases and accounting gimmickry to support elevated profit margins. All of these functions are finite in nature, and despite much hope to the contrary, the current set of fundamental variables are more usually witnessed at the end of cyclical expansions rather than the beginning.
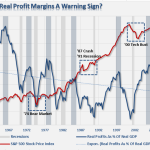
The discussion of profit margins, as they relate to this or that, certainly makes for interesting commentary. However, as investors, what we seek is insight into the potential of future equity returns, or more importantly, recessions. The chart below compares real profit margins to the S&P 500.
What we find is that peaks in corporate profits margins have historically corresponded, not surprisingly, with peaks in equity markets. Since the media, analysts and managers push the “stocks are cheap” meme using linear extrapolation of earnings, it is the eventual reversion in earnings that lead to market corrections as expectations and reality collide.
With corporate profits being driven primarily by “accounting magic” rather than strongly rising revenue, the sustainability of the current level of corporate profits is in question. This is particularly the case if we are indeed closer to the next economic recession than not considering that we are already in one of the longer economic expansions on record.
This point should not be dismissed lightly. While the Fed’s ongoing interventions since 2009 have provided necessary support to the current economic cycle, it has not “repealed” the business cycle entirely. The Fed’s actions work to pull forward future consumption to support the current economy. That forward pull of consumption, combined with the effectiveness of corporate profitability tools, were extremely effective in boosting profit margins.
However, such actions leave a void in the future that must eventually be filled by organic economic growth. The problem comes when such growth doesn’t appear. With the economy continuing to “struggle” at an anaemic growth rate at best, the effects of corporate profitability tools have become much less effective.
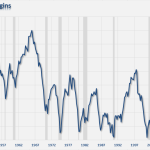
If corporate profits as a percentage of GDP are indeed peaking, as the chart above would suggest, then there is potentially trouble ahead for investors. This is not a “bearish” prediction of an impending economic crash, but rather just a realization that all economic, and earnings, forecasts, are subject to the overall business cycle. The problem with earnings forecasts, or even the CBO’s 10 year economic growth projections, is that they fail to factor in the probability of an average economic recession. That mistake has always eventually produced a very disappointing outcome.
See the original post –
Profit Margins And Stock Market Reversions | Zero Hedge
See which stocks are being affected by Social Media

