

SILVER Elliott Wave Technical Analysis – 10th January, 2014 | Lara …
SILVER Elliott Wave Technical Analysis – 10th January, 2014
By:
| Sat, Jan 11, 2014
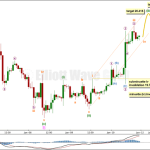
Last analysis of Silver on 31st December, 2013 expected a trend change and
upwards movement. This is exactly what has happened so far. If price moves
above 20.489 the new upwards trend would be confirmed.
The wave count remains the same.
Minor wave B is now a complete zigzag, which is within a bigger zigzag trending
upwards one degree higher for intermediate wave (B).
Price movement above 20.489 would provide confidence in this trend change.
At that stage upwards movement could not be a second wave correction within
the final fifth wave down of minuette wave (v), and so minuette wave (v) would
have to be over.
Further upwards movement above the pink parallel channel would provide more
confidence in this trend change. A clear channel breach with a full daily candlestick
above this channel and not touching the upper trend line would provide this
confirmation.
At 25.49 minor wave C would reach equality in length with minor wave A. Minor
wave C should find resistance at the upper edge of the big blue channel about
this large zigzag.
Minor wave B ended in 88 days, just one short of a Fibonacci 89. Minor wave
C should last about 34 to 89 days, depending upon what structure it takes.
Minor wave C must subdivide into a five wave structure, either an ending diagonal
or an impulse. An ending diagonal would be more time consuming. An impulse
would be faster and is more likely as it is a more common structure.
Within the new upwards trend no second wave correction may move beyond the
start of its first wave. This wave count is invalidated with movement below
18.585.
Minute wave i completed a five wave impulse upwards. Minute wave ii completed
as a regular flat correction with an abnormally long minuette wave (c), but
all subdivisions are correct. Minute wave ii was a deep 58% correction of minute
wave i.
Minute wave iii shows an increase in upwards momentum beyond that seen for
minute wave i, confirming this is a third wave unfolding.
At 22.197 minute wave iii would reach 1.618 the length of minute wave i. I
would expect this target to be about three to five days away.
Within minute wave iii at 20.415 minuette wave (iii) would reach 2.618 the
length of minuette wave (i). This target may be reached most likely on Monday,
but may be reached on Tuesday.
Draw a parallel channel about minuette wave (iii) using Elliott’s first technique.
Draw the first trend line from the highs labeled subminuette waves i to iii,
then place a parallel copy upon the low of subminuette wave ii. I would expect
subminuette wave iv to find support at the lower edge of this channel, and
for the following upwards wave of subminuette wave v to find resistance at
the upper edge of this channel. Subminuette wave iv may not move into subminuette
wave i price territory. This wave count is invalidated with movement below
19.726.
When this channel is clearly breached by subsequent downwards movement that
shall provide first indication that minuette wave (iii) is over and minuette
wave (iv) is underway. I would not expect minuette wave (iv) to last longer
than a day and it should not show on the daily chart as a red candlestick.
Minuette wave (iv) may not move into minuette wave (i) price territory. This
wave count is invalidated with movement below 19.714.
Overall this wave count expects more upwards movement with smaller corrections
along the way.
Please enable JavaScript to view the comments powered by Disqus.
Author: Lara Iriarte
Lara Iriarte
elliottwavegold.com
Elliott wave is one of the more difficult and complicated technical analysis
tools. When done right it can be uncannily accurate.
I have been using the Elliott wave principle to analyse up to five markets
a day since 2008. I began Elliott Wave Forex (originally ForexInfo.us) in
2009 to provide daily analysis of EURUSD and GBPUSD, then I began Elliott
Wave Stock Market in 2010. Elliott Wave Gold began in August, 2013. Currently
I provide daily analysis of Gold on this site, and daily analysis of the
S&P 500 on Elliott Wave Stock Market for its members.
I have a science background (BSc) which has trained me to think logically
and be evidence focussed. Over the years I have seen no market movement which
does not fit into the clear and restrictive rules for Elliott wave structures.
I have members who are fund managers, institutional investors and professional
traders.
If you want to learn how to apply the Elliott wave principle to any market
my analysis service is designed to teach you, daily, how to do this.
Copyright © 2013-2014 Lara Iriarte
All Images, XHTML Renderings, and Source Code Copyright © Safehaven.com
See original article:
SILVER Elliott Wave Technical Analysis – 10th January, 2014 | Lara …
See which stocks are being affected by Social Media

