
STTG Market Recap Dec 12, 2014 – Stock Trading To Go
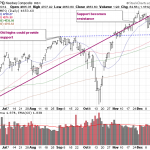
After 7 straight up weeks, the market finally came back some this week. The havoc in the oil market continues to cause consternation. Friday indexes opened down a bit and continued to selloff as the day progressed. The S&P 500 fell 1.62% and the NASDAQ 1.16%. For the week the S&P 500 had its worst performance since May 2012 at -3.5%, which shows you how spoiled we have all become with a market that almost always goes up.
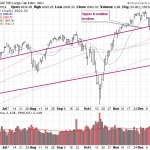
The NASDAQ had broken upper support a few days ago and now “support becomes resistance”. Yesterday’s spike was stymied at our trendline. There is an obvious level to bounce from coming very soon as we show in the dotted line below. The S&P 500 broke its upper support line for the second time this week, this time with fury – and fell down exactly to its 50 day moving average.
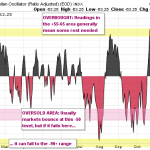
We are now firmly oversold on the NYSE McClellan Oscillator – most of the time we get a bounce from this level, even if for a short period of time. See February and April. Less commonly, we can see a new leg down, as we saw in August and October.
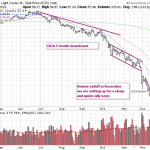
Oil continues to be the story as we simply cannot find a bottom here. Things are getting stretched to an extreme so very soon we should see a “rubber band” effect where we get a sharp snap back rally of 2-4 days and the move will be violent. Of course trying to guess what day that is, is the trick!
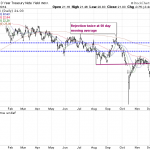
10 year Treasury yields are back down to the 2.1% range which makes for the second lowest close of the year – that is not a data point that indicates a great economy. Which contrasts a lot with the economic data of late. It also indicates some fear out there as people tend to liquidate stocks and run into Treasuries during selloffs.
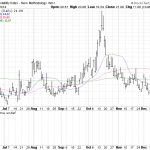
This can also be expressed by the spike in the volatility index.
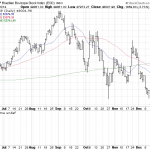
While the drop in oil is good for U.S. consumers, remember there is always else on the other side of the transaction. Countries with heavy oil production get hurt – Russia, Nigeria, and Brazil for example. Here is Brazil’s stock market which has been selling off for months.
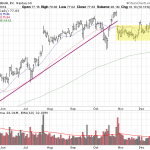
We mentioned this breakout in Facebook (FB) – while today’s gain was small, in the face of heavy selling this is positive pressure. This looks like a stock that wants to make a nice run but the market this week held it back.
Here is a nice multi page infographic from Bloomberg showing how the U.S. appetite for energy is morphing. Have a good weekend and we’ll see you back here next week.
See original:
STTG Market Recap Dec 12, 2014 – Stock Trading To Go

