
STTG Market Recap July 18, 2014 – Stock Trading To Go
In yesterday’s recap when describing the late day selloff we wrote:
All the typical knee jerk reactions took place – U.S. Treasuries were bid up, oil and gold spiked, as did volatility etc. How much of this is real humans trading and how much is just computers trading with each other we will soon see.
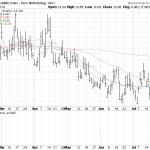
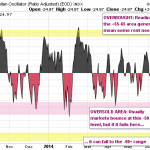
One must keep in mind how computerized the market has become. When a news event hits a lot of the automatic trading goes into overdrive and there is little one can take from it most of the time. It becomes a market on autopilot. Of course if it is followed by more bad news than humans generally will pile on in the days following but as we saw today when all these knee jerk reactions happen so quickly, often we see a quick reversal soon after. Considering the market was very short term oversold per the NYSE McClellan Oscillator – we also had that on the bulls side for at least a quick short term bounce.
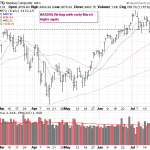
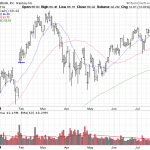
Friday the S&P 500 gained 1.03% and the NASDAQ 1.57%. So just about all of yesterday’s losses were regained just like that; stocks gapped up at the open and rose all day. The Thomson Reuters/University of Michigan’s initial July reading on consumer sentiment came in at 81.3, less than estimated; but the market was not concerned with it.
We had a nice rebound in the 2 major indexes and no major damage was done yesterday.
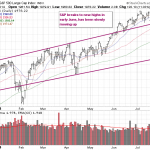
The volatility indexed exploded up yesterday and just as quickly imploded today.
Here is the huge rebound in the NYSE McClellan Oscillator – it was below -60 yesterday.
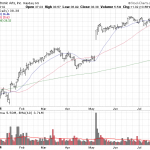
As we mentioned yesterday Google (GOOG) had been up about 1% in after hours but investors seemed to like what they heard far more today and the stock surged.
Somewhat related names such as Facebook (FB) also received a halo effect from Google.
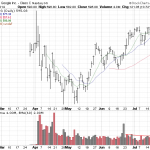
Electronic Arts (EA) – a video game maker – reports on the 22nd of July so is a gamble to buy ahead of those earnings (not recommended) but we can still look at its very bullish chart as a pattern to learn from. After its last report it gapped up, never came back down, and held steady in a tight range the past 7-8 weeks. Today it broke out of that range nicely. If there was not an earnings report to contend with this is exactly the type of breakout one would want to buy for an intermediate term purchase. If it were to fall right back down into the range it has been over the past 2 months then it would have been a false breakout.
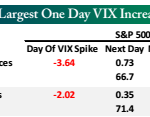
BeSpoke Premium has more on the behavior of the volatility index (VIX) here. It shows that extreme short term spikes up, generally give you a very nice term short term opportunity on the long side. (1 day to 1 week)
As shown in the table, following each of the 21 prior occurrences, the S&P 500 saw a snapback the following day with an average gain 0.73% with positive returns two-thirds of the time. Over the following week, the average returns improves to 0.77%. Then, over the following month the index averages a decline of 0.63%, and then swings back to a gain of 1.23% over the next three months.
Have a good weekend and we’ll see you back here Monday.
Visit source:
STTG Market Recap July 18, 2014 – Stock Trading To Go

